
Precision Fire Protection News
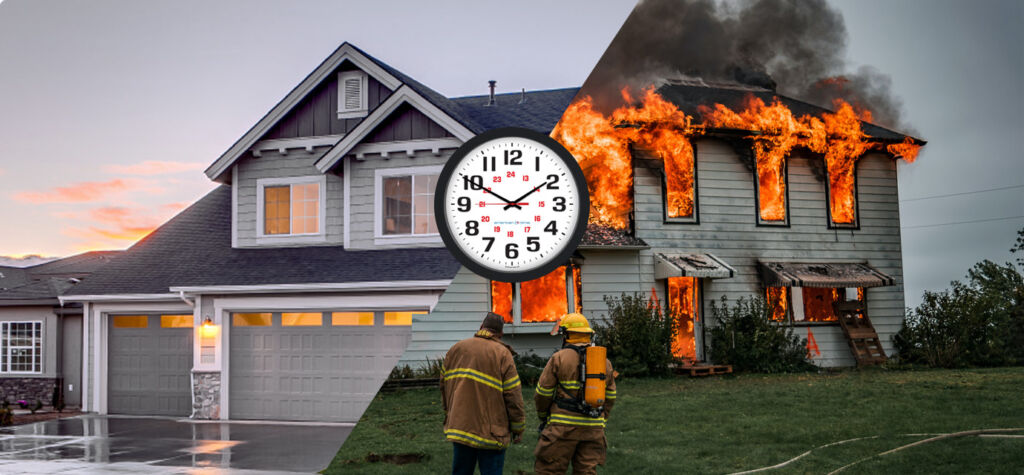
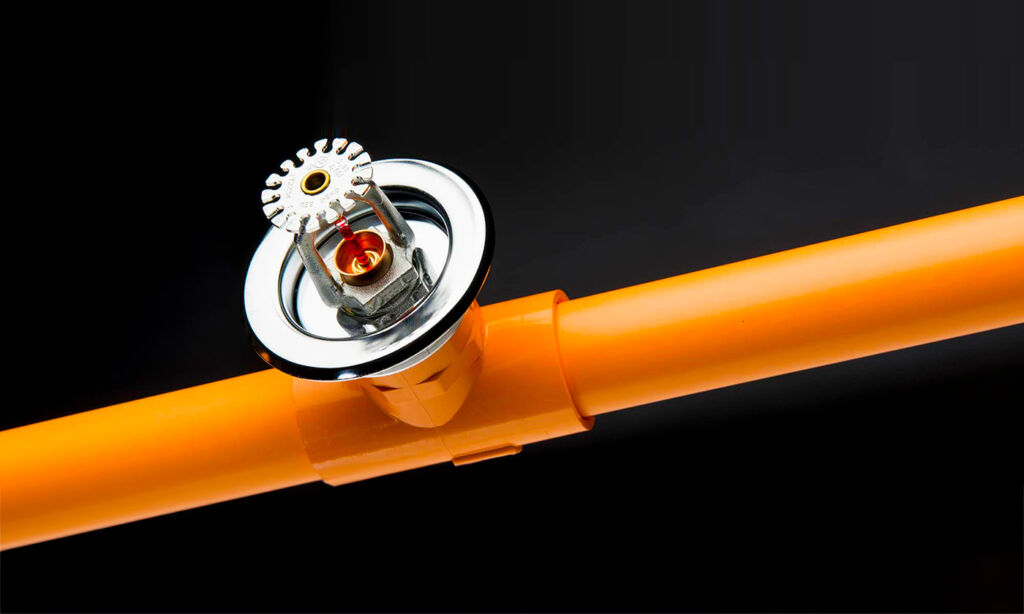
The Sprinkler Difference

A new study puts a dollar amount on the damage caused by sprinklered fires versus non-sprinklered fires — and in industrial occupancies, those dollar differences can get very large
BY FRED SANFORD
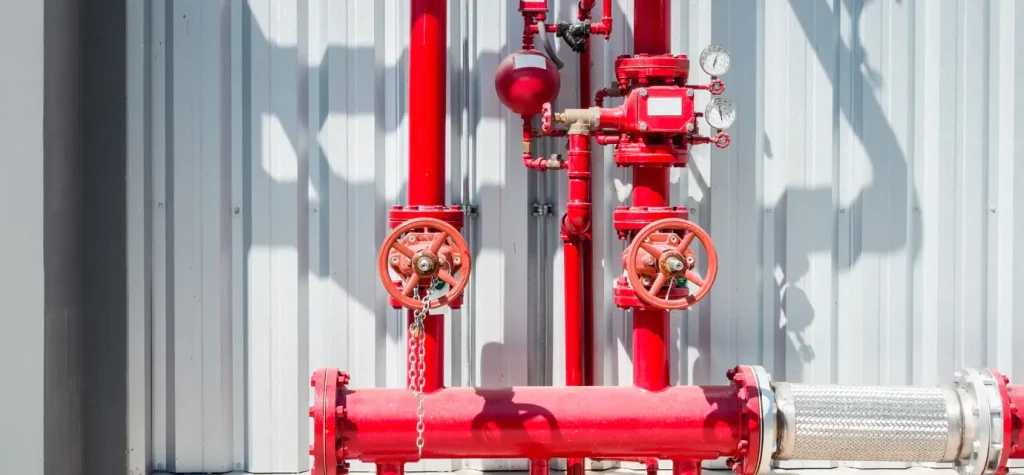
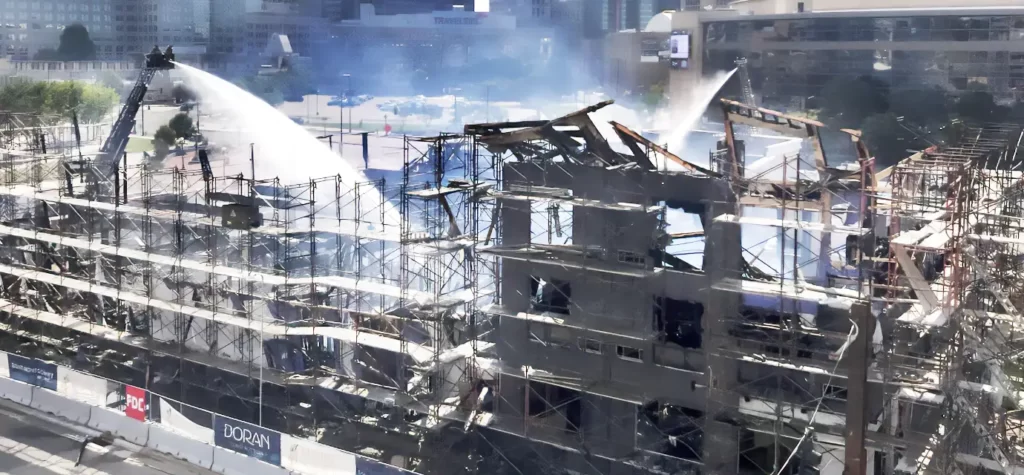
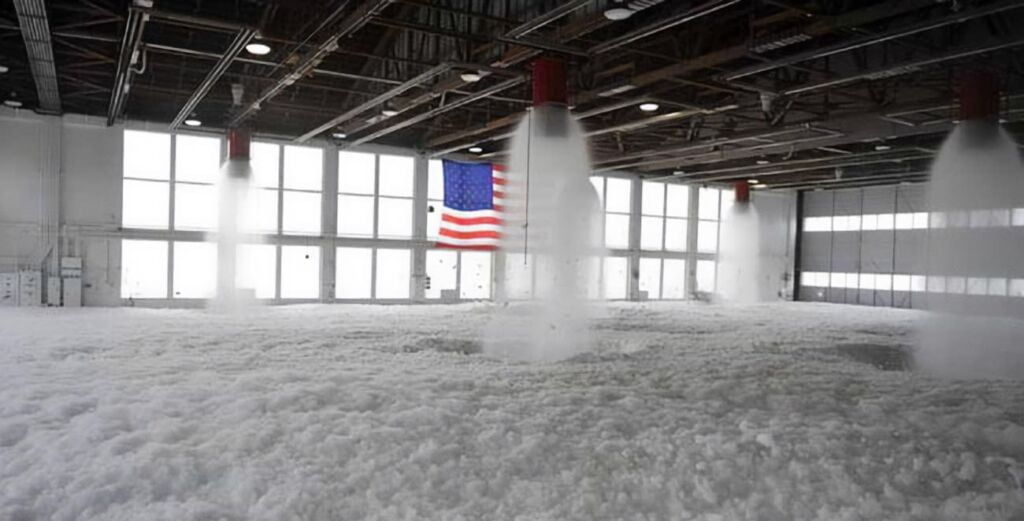
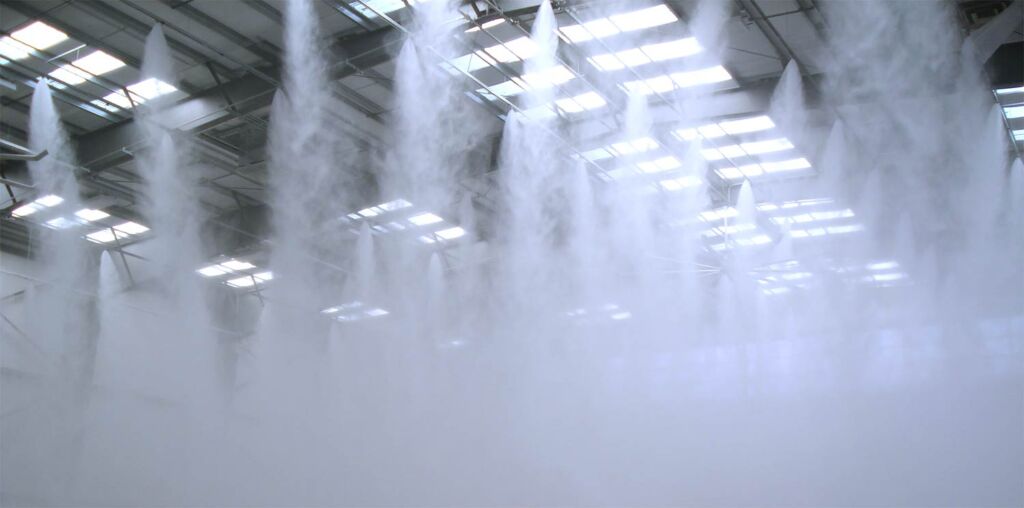
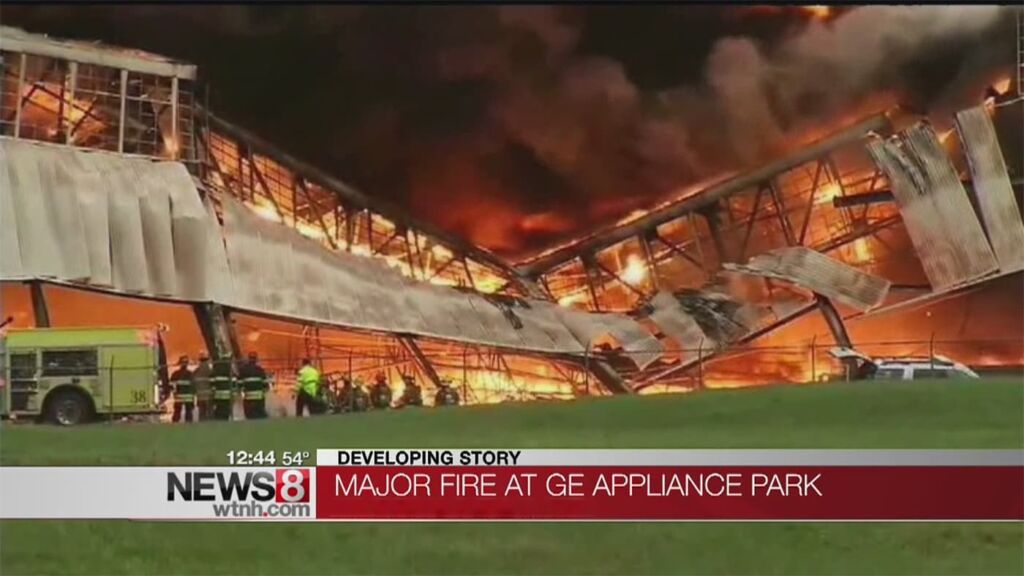
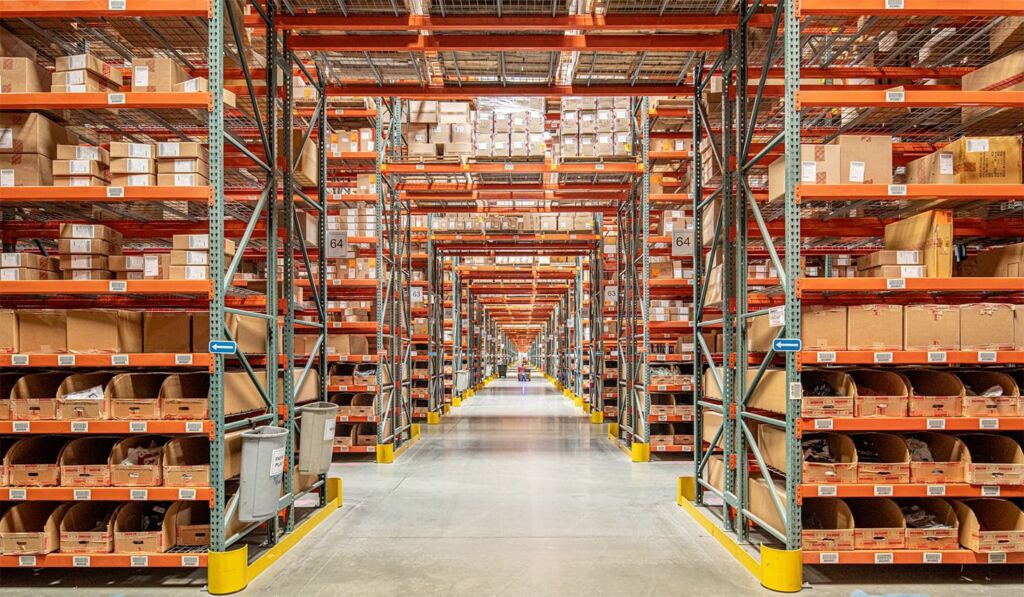
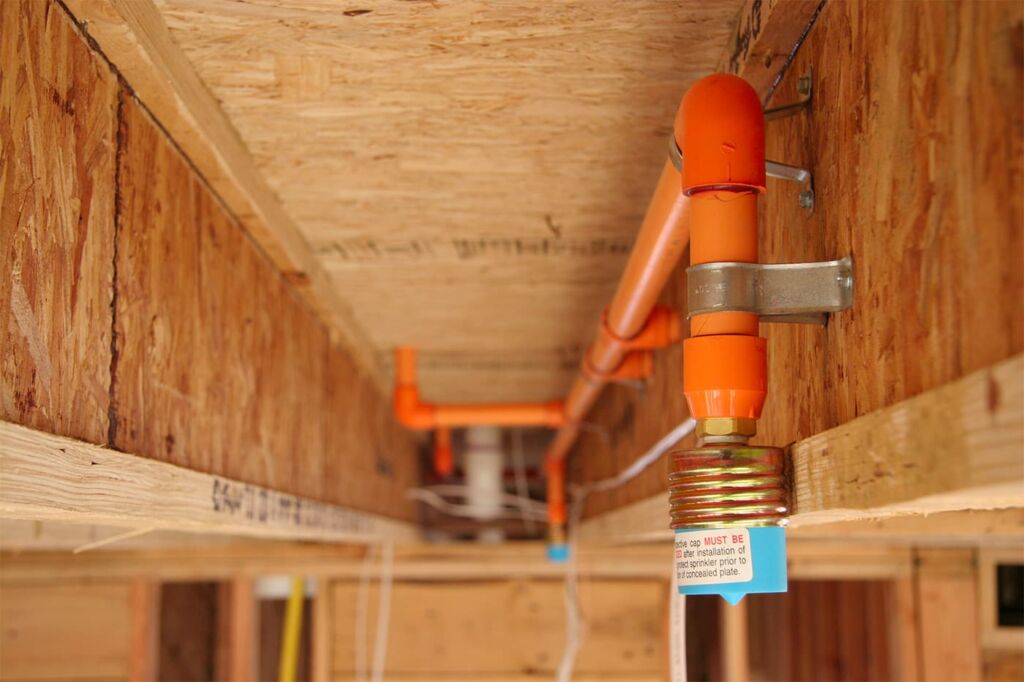
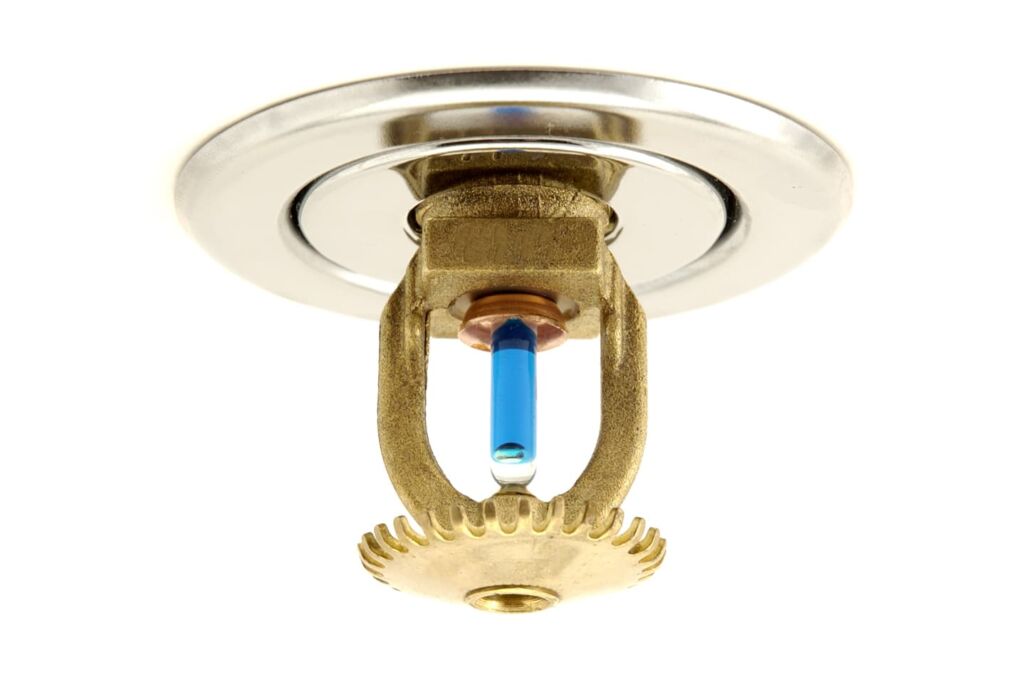
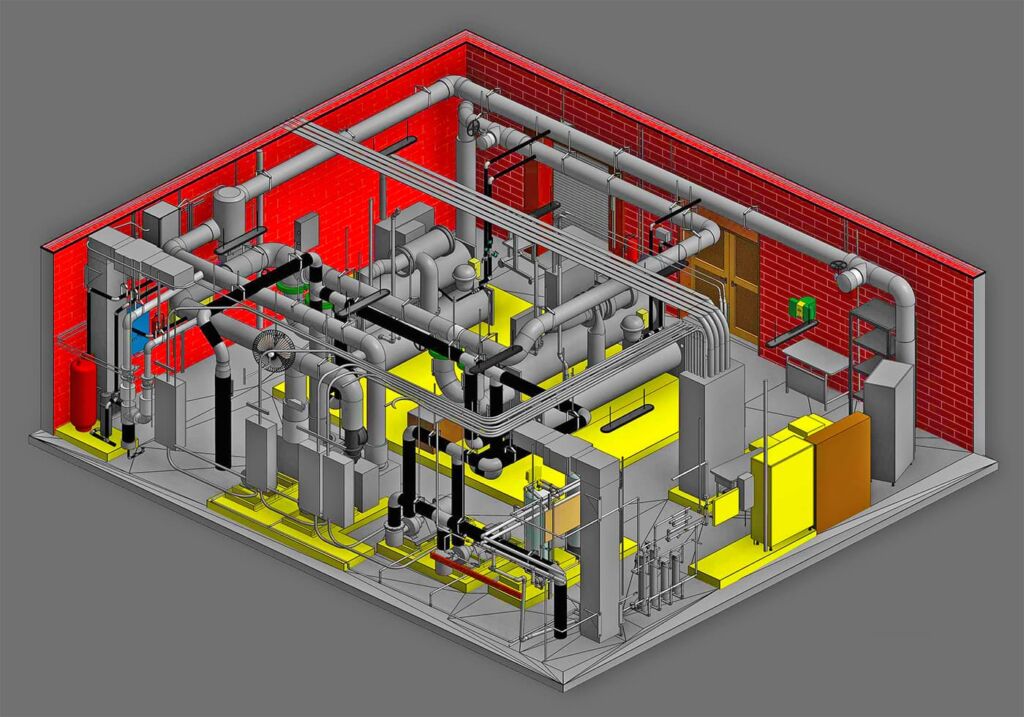
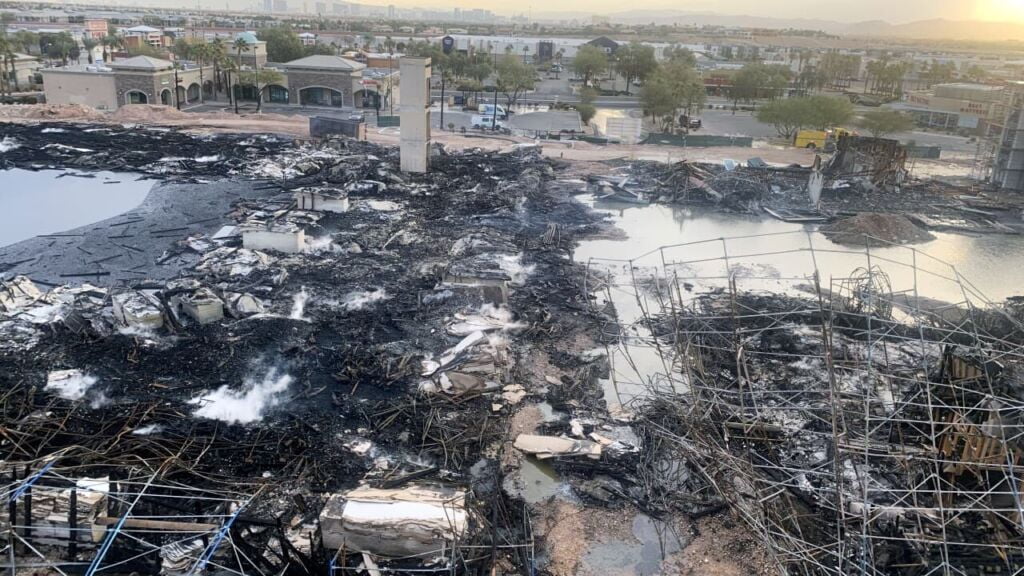
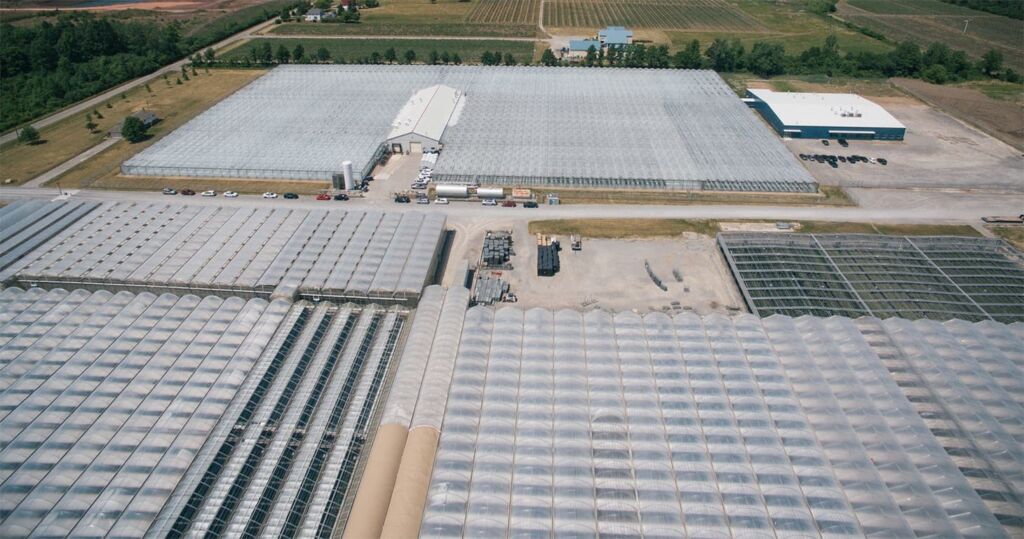
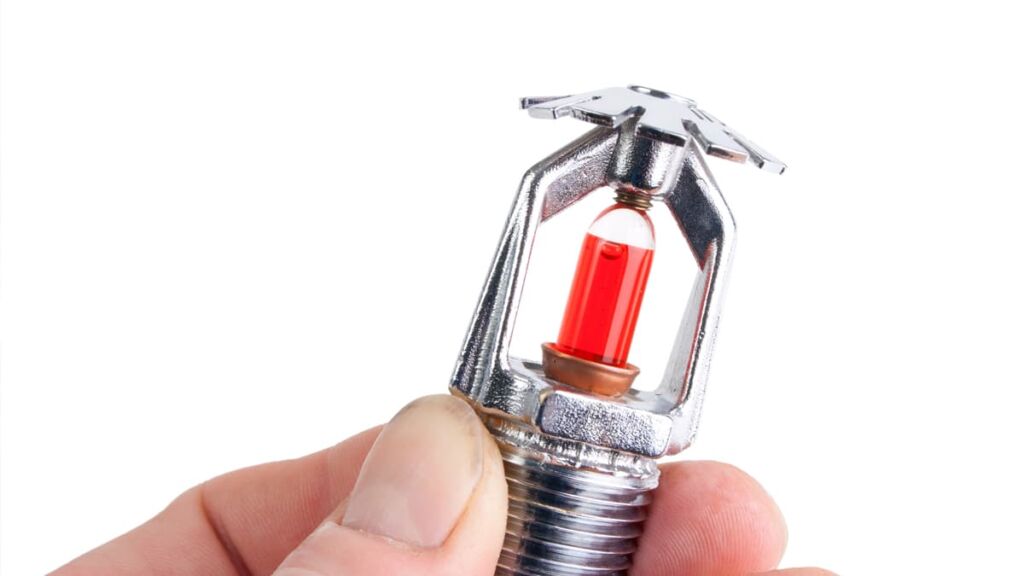
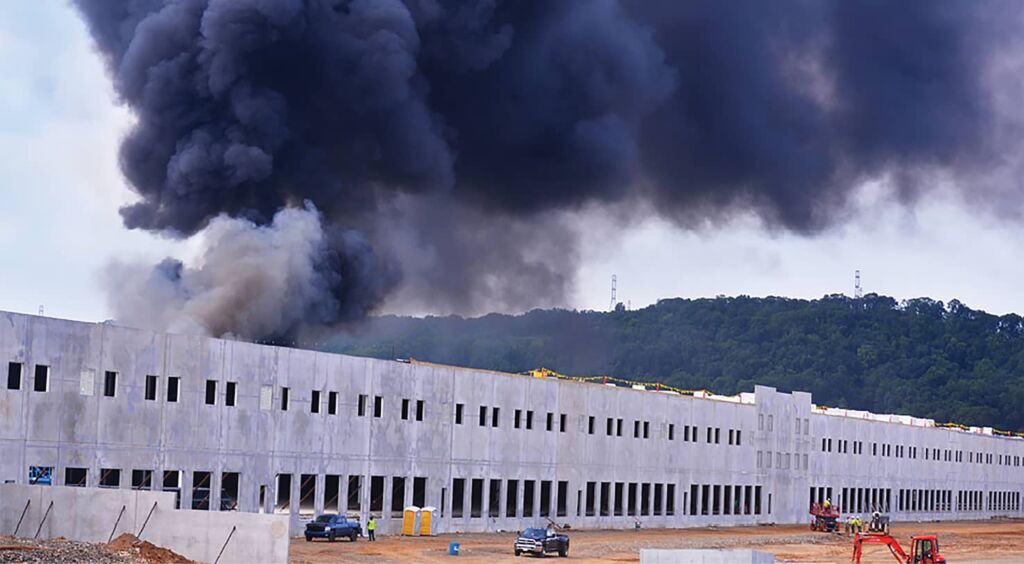
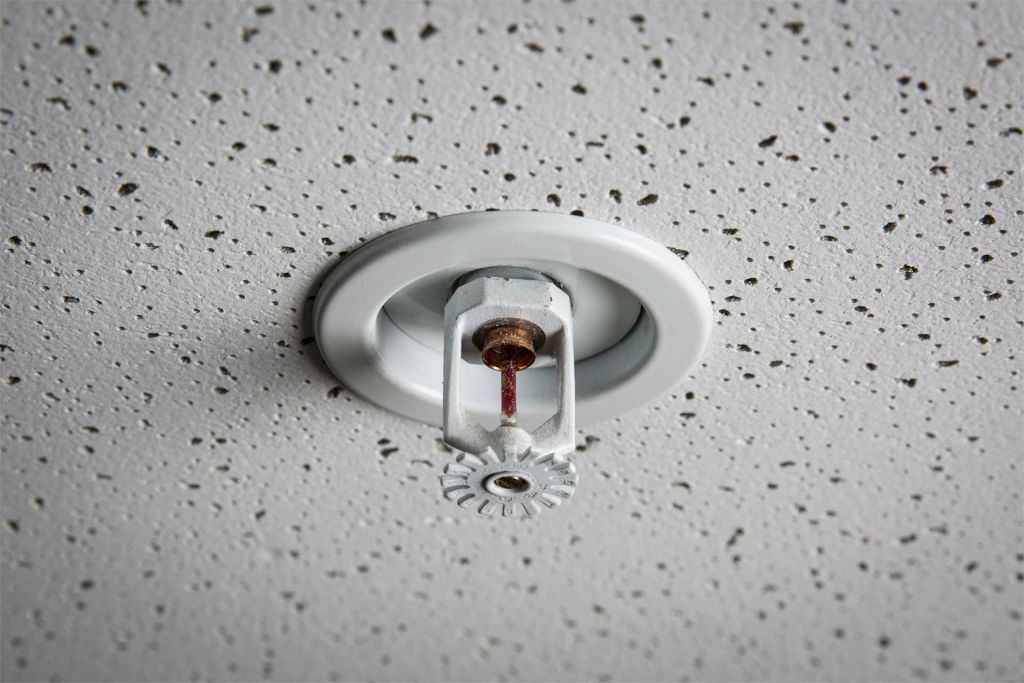
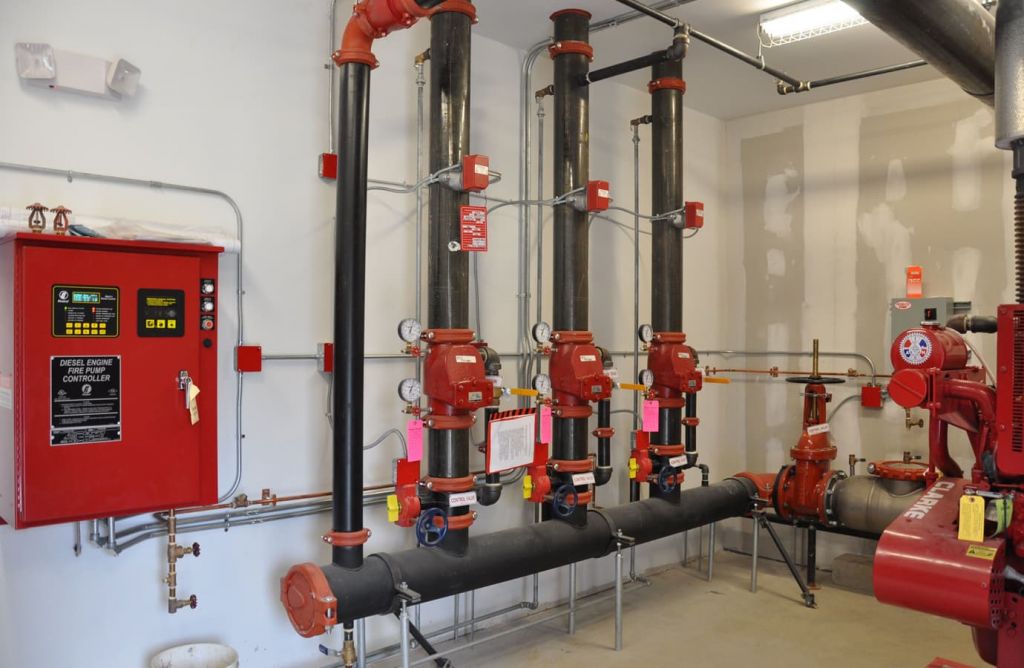
IT’S BEEN LONG RECOGNIZED by property insurers and firefighting professionals that sprinklered properties generally suffer less damage in fires than non-sprinklered properties. Nowhere is that more true than in industrial occupancies; fires in these settings tend to be disproportionately more damaging than fires in other types of occupancies. It can be argued that without the automatic sprinkler, industry in the United States would not have developed as rapidly and to the extent that it has. From the early models of sprinklers in the mid-19th century, which kept the wooden floors of New England mills wet by spraying water in every direction, to the standard spray sprinklers of the 1950s, which cooled light steel construction by setting up an umbrella pattern of finer droplets, sprinklers have fulfilled their promise. Nowadays, in response to ever-higher storages and modern exposures, early suppression fast-response (ESFR) sprinklers and other specialized types of suppression are able to drive larger droplets down through the fire plume to control and suppress fires in their incipient stages.
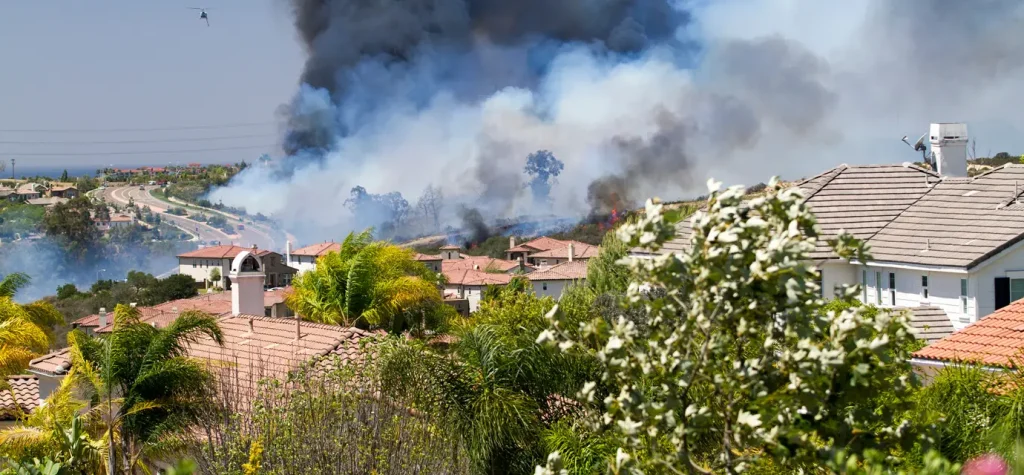
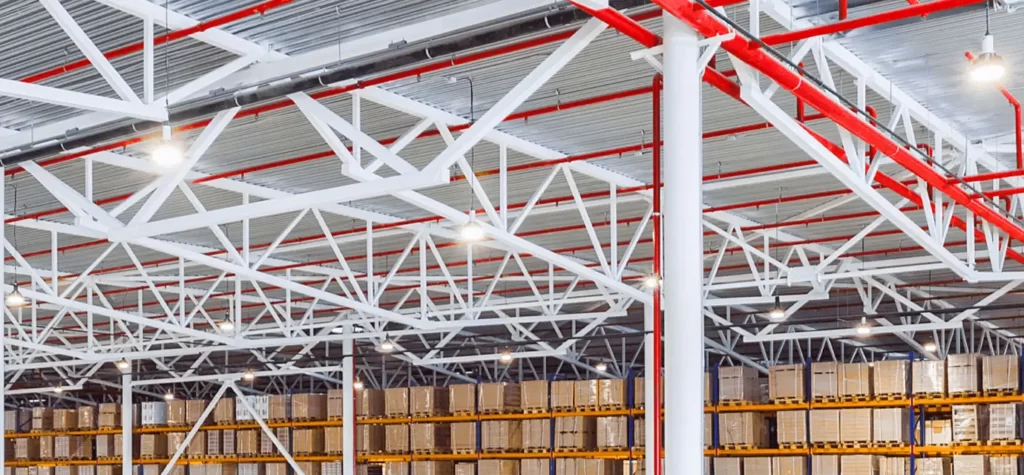
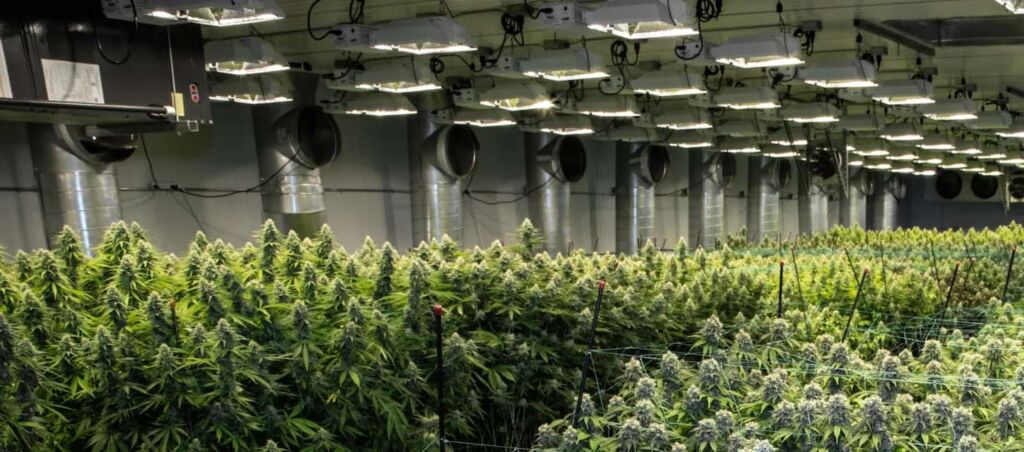
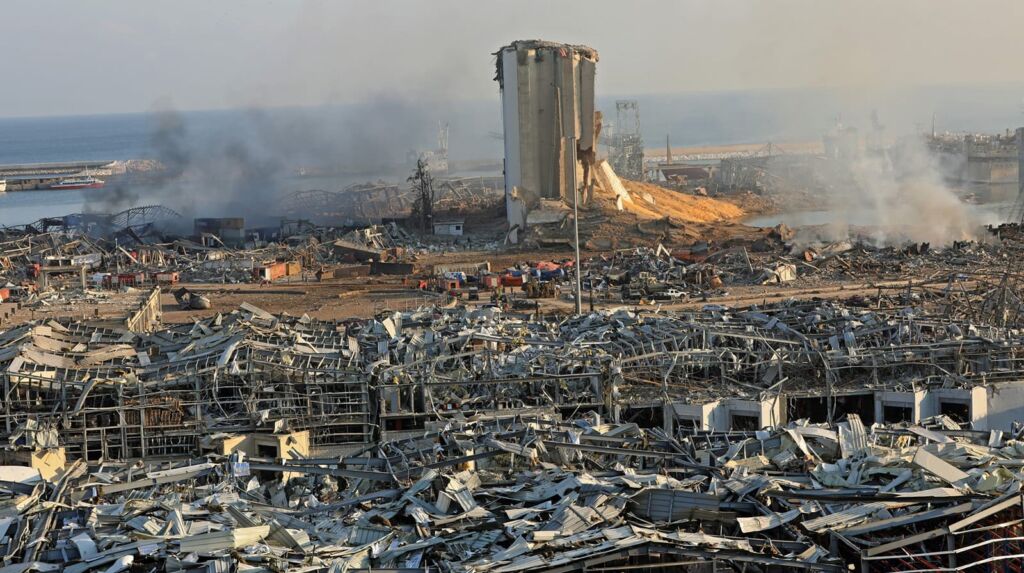
A 14-year study of hundreds of fires by Liberty Mutual Insurance’s Property Risk Engineering Group underscores the importance of fire sprinklers in minimizing property damage, especially in industrial occupancies. The study looks at 946 serious fires that occurred from 2000 to 2013 across 11 different occupancy types, with threshold dollar damage estimates of $100,000 and greater. The total estimated damage of those fires was $1.2 billion. Of the fires studied, 322 were industrial fires: 269 in manufacturing occupancies and 53 in warehouse occupancies. While those fires made up just over a third of all the fires included in the study, they were responsible for 49 percent of the total estimated damage.
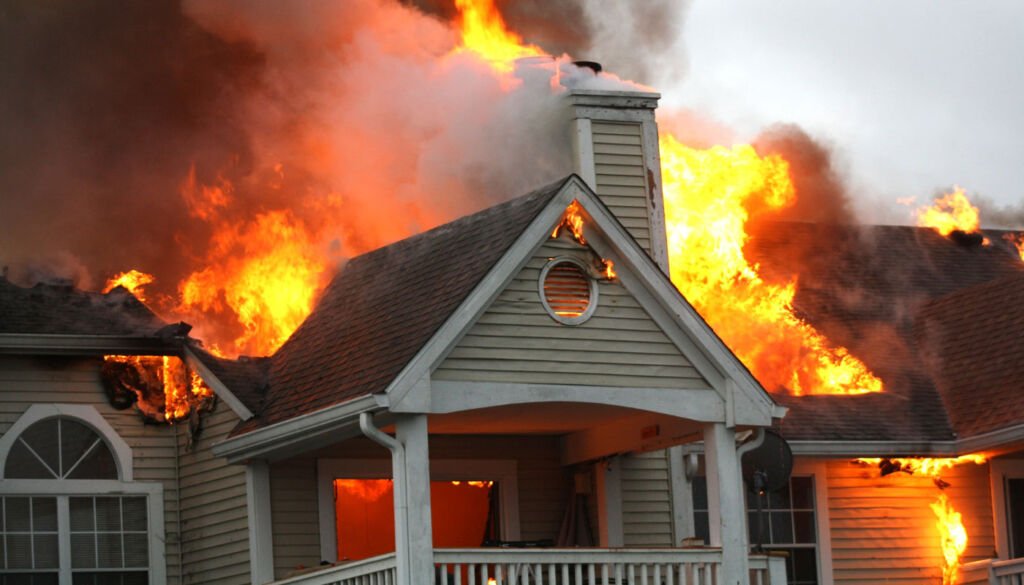
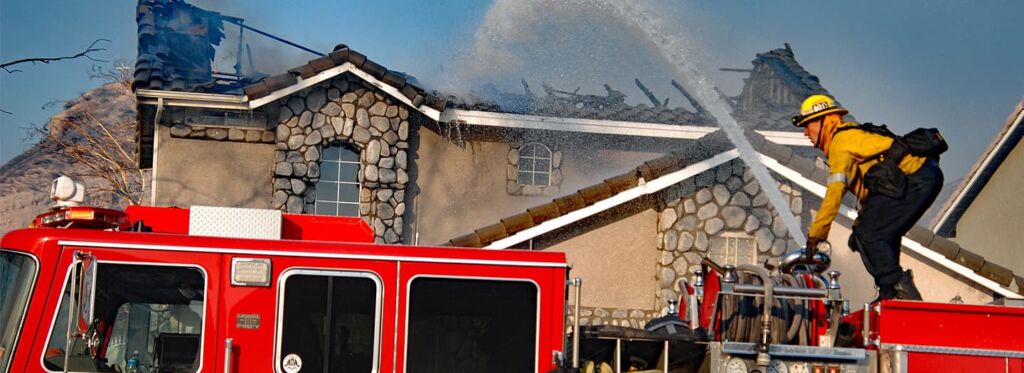
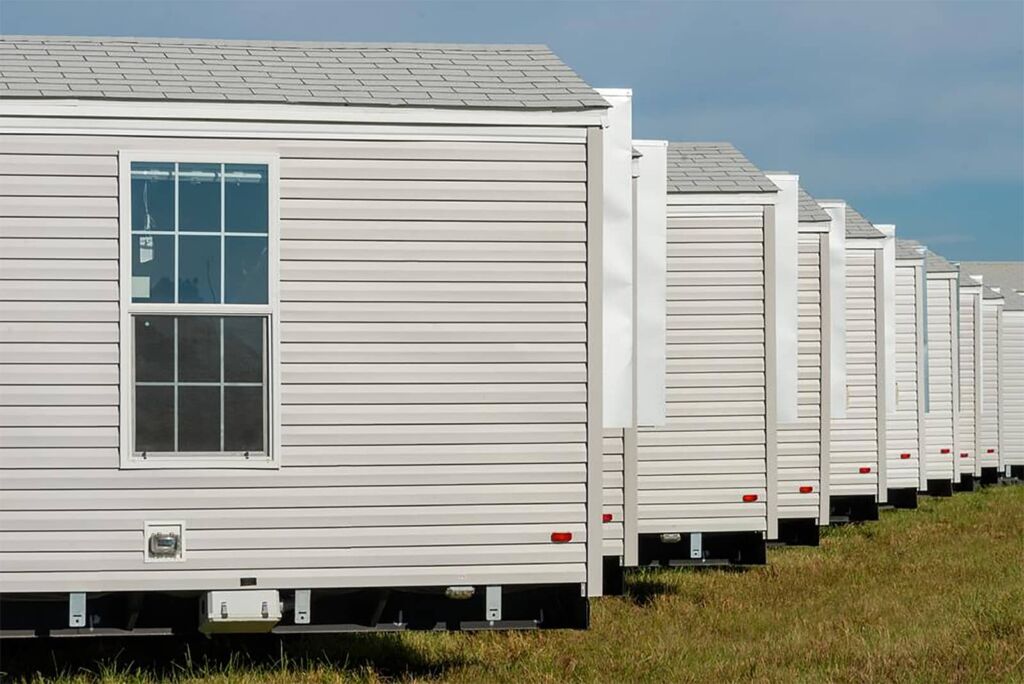
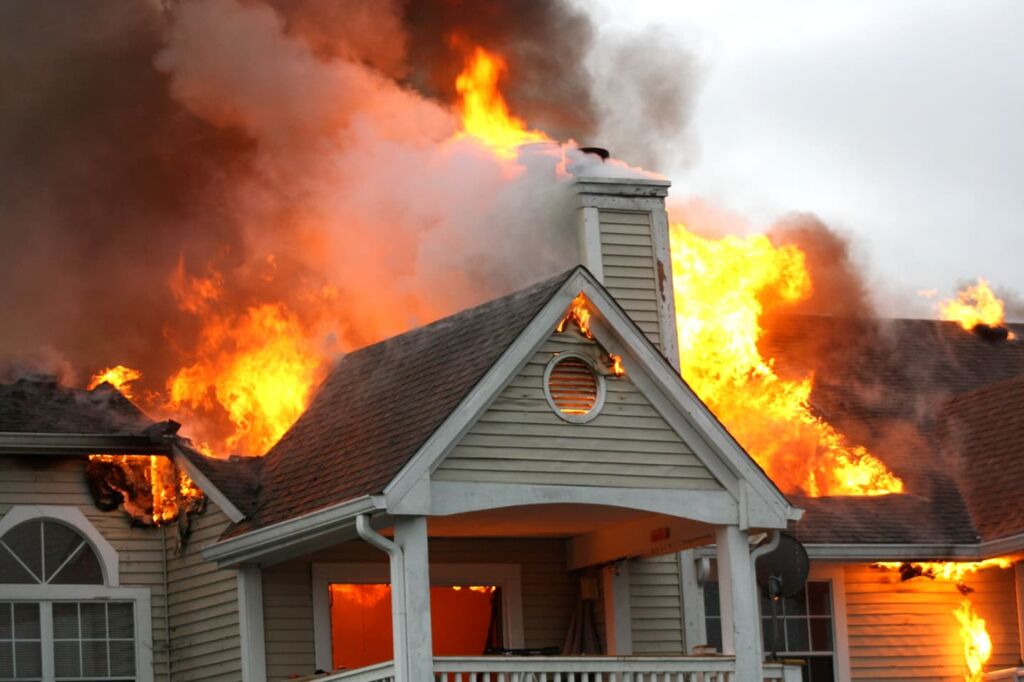
The findings supported the notion that the “heavier” the occupancy, such as industrial, the proportionately more damaging fires tend to be. In this study, for example, while residential fires accounted for 8 percent of the number of serious fires, they accounted for just 4 percent of the total estimated damage of those fires. Even within the manufacturing occupancies themselves, such as a foundry compared to a watch manufacturer, the heavier end tends to produce the more damaging and costly fires. Overall, in a comparison of estimated fire damage in non-sprinklered versus sprinklered industrial occupancies, fires in non-sprinklered facilities averaged an estimated $1.9 million in damage compared to $638,000 in sprinklered facilities, or a ratio of about 3:1.
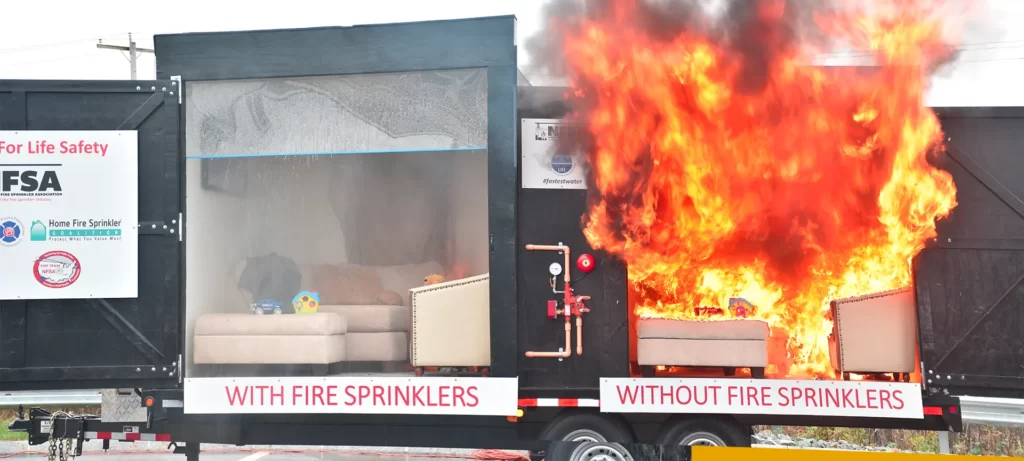
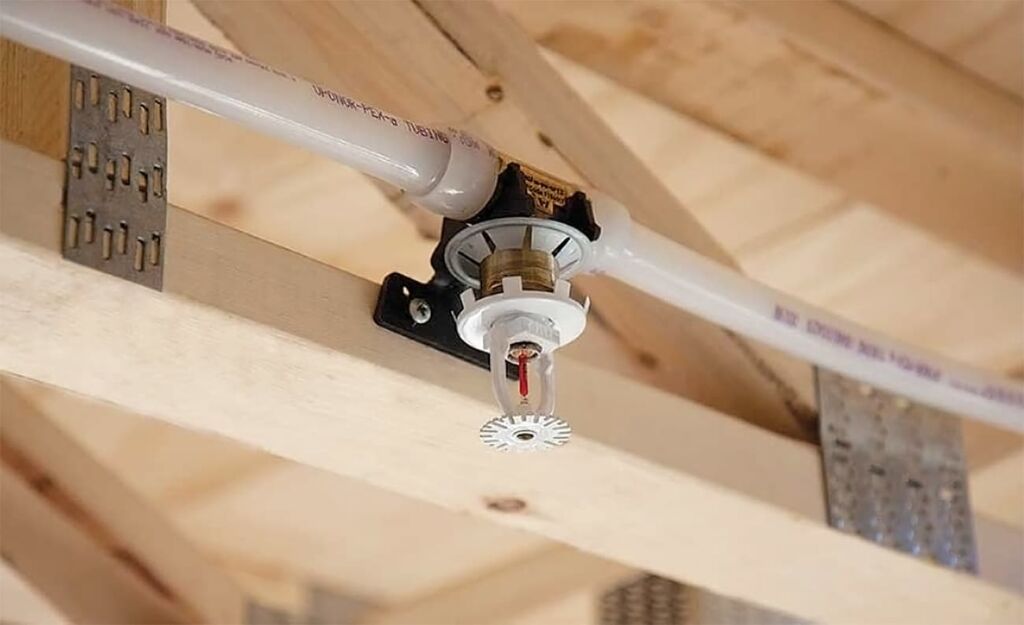
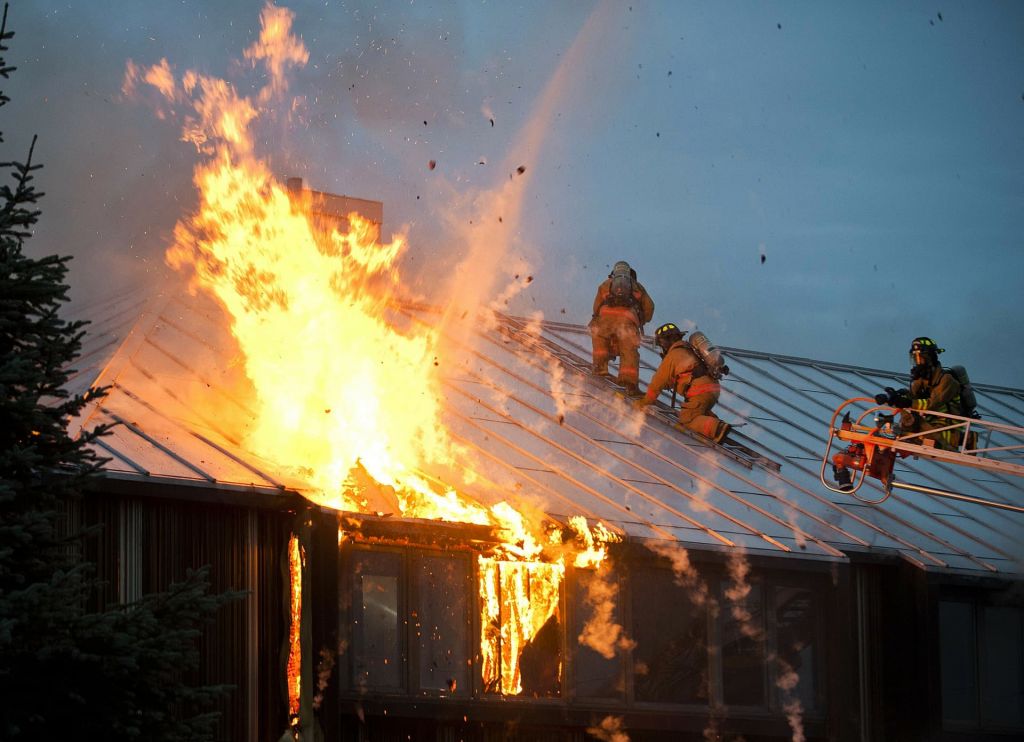
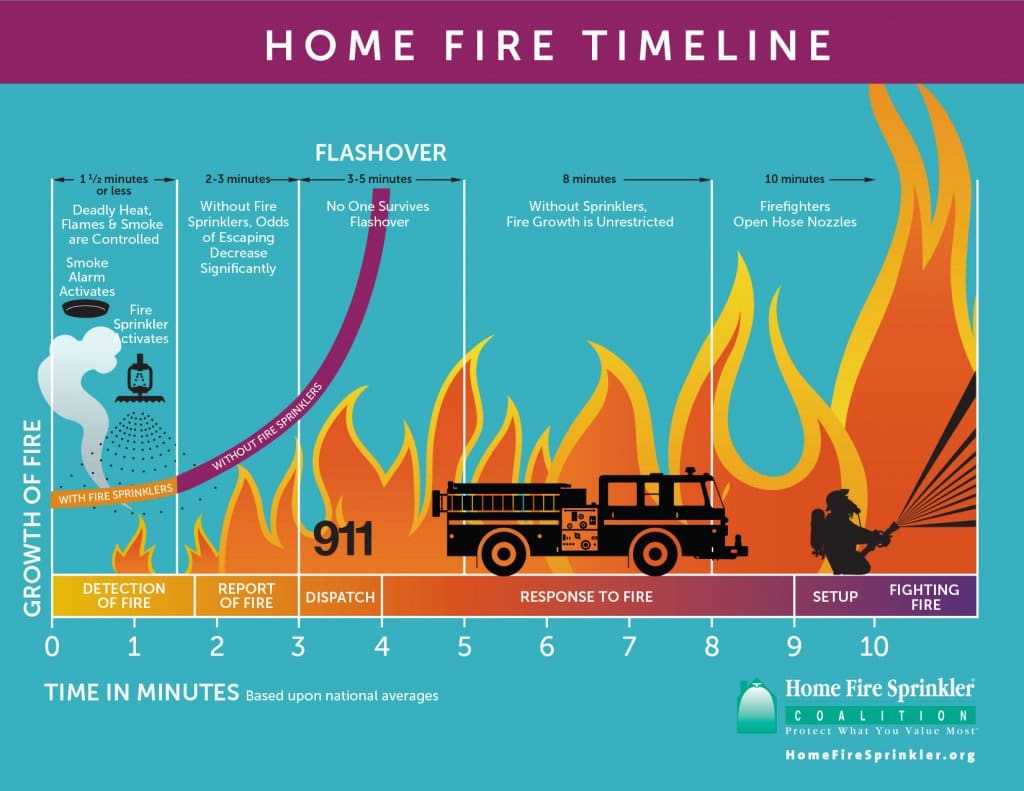
While we are unable to share the actual report with the public due to issues of confidentiality, we felt an overview here would lend valuable support in the cause of automatic sprinklers in industrial occupancies. The story told by the study isn’t that non-sprinklered fires get big—we knew that already. The critical point is that when sprinklers are installed in the area of origin and operate as designed, fires almost always remain small. Now, we have the dollars-and-cents comparisons to prove it.
Running the numbers
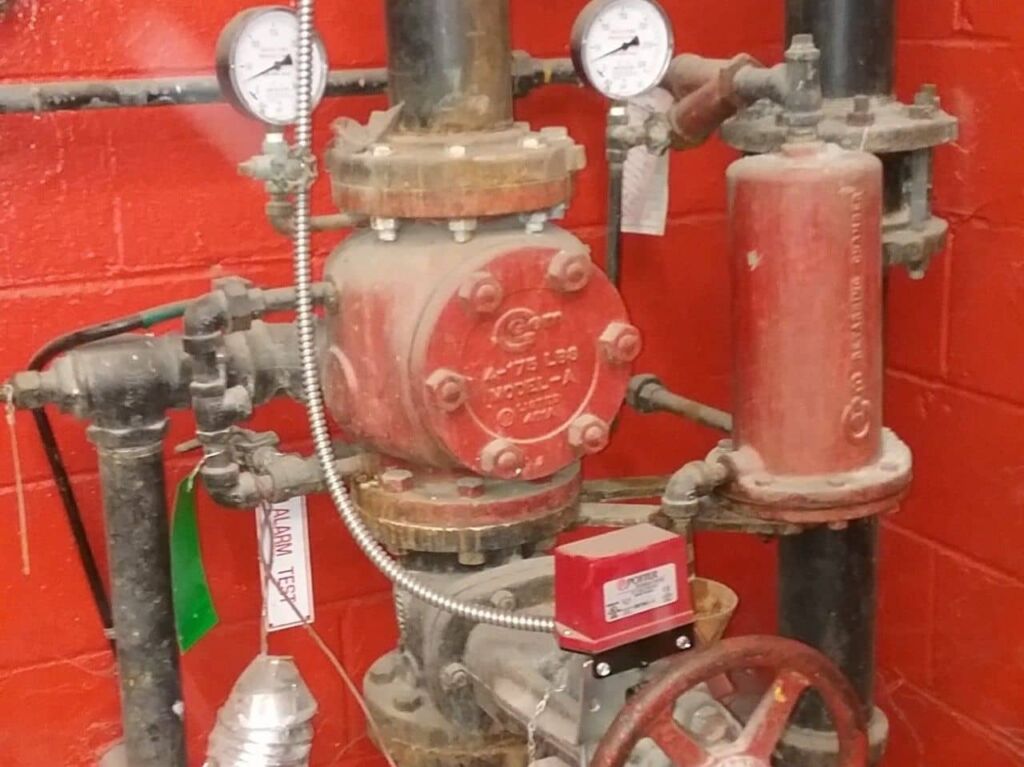
We segmented our data in four ways: fires where sprinklers were installed in the area of origin and operated as designed; fires where sprinklers were not installed, but clearly could have been and would have operated; fires where sprinklers were not, and probably would not have been, a factor; and fires where sprinklers were impaired or otherwise adversely affected by physical conditions, as in instances where fire gained headway in a non-sprinklered concealed space or where water supplies were clearly deficient.
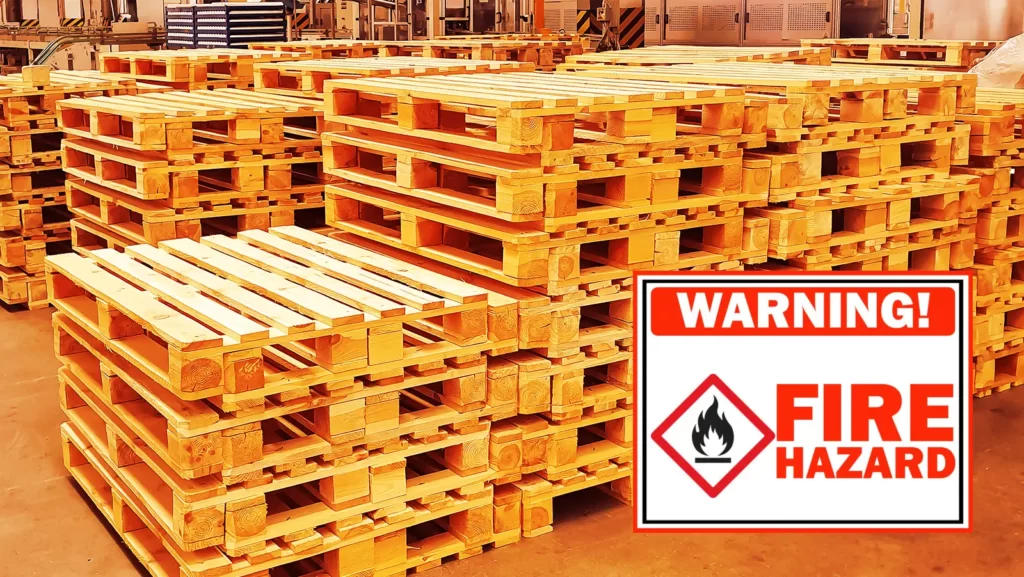
We also compiled comparative data for 11 different categories of manufacturing operations: heavy metal classes, food, rubber/plastics, paper/printing, textile/apparel, stone/glass, wood/furniture, chemical/petroleum, buildings only, light metal classes, and agricultural. Again, fires at the heavier end of the metal classes were disproportionately more damaging on average; the heavy metal classes totaled 43 percent of the 269 manufacturing fires, but accounted for 60 percent of the $502 million of estimated damages caused by those fires.
Again, although not universal, the tendency was for a greater differential in estimated damage between non-sprinklered and sprinklered fires among the heavier occupancies. In the heavy metal classes, the average non-sprinklered fire damage was nearly $3.1 million, compared to $819,000 for sprinklered occupancies, or a ratio approaching 4:1. Similarly, for textile/apparel, the average non-sprinklered fire damage was slightly more than $1.9 million, compared to $461,000 for sprinklered occupancies. In all categories except for two — rubber/plastics and wood/furniture — the difference between the average fire damage involving sprinklered and non-sprinklered manufacturing occupancies was significant.
|
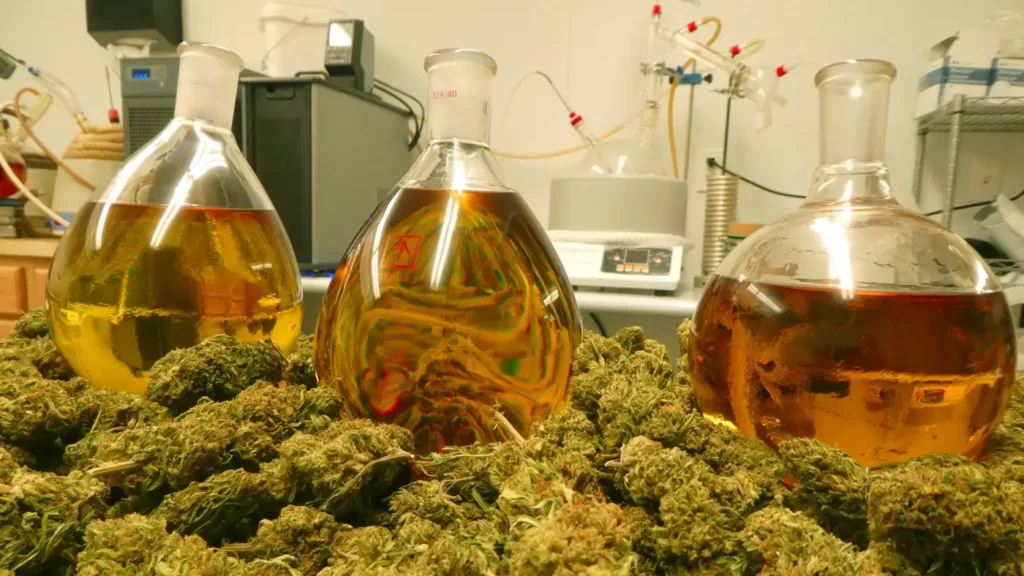
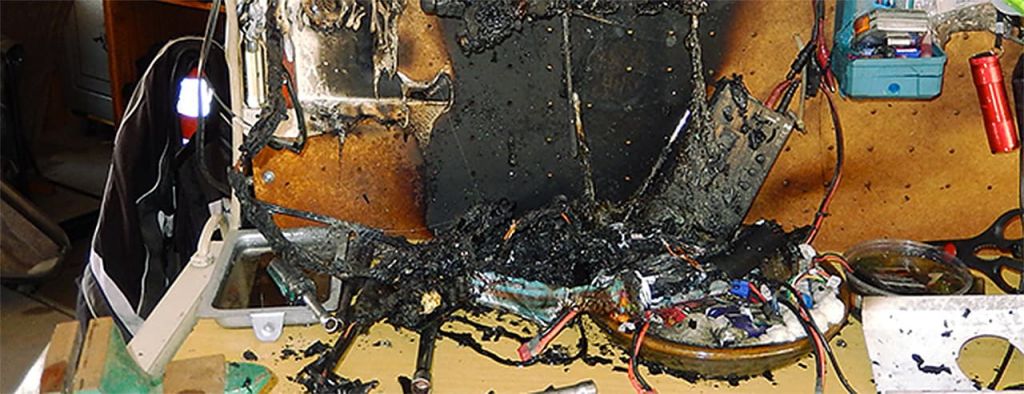
These categories bear a somewhat closer look, however. For rubber/plastics, the estimated fire damage in non-sprinklered occupancies averaged $788,000, compared to $766,000 in sprinklered occupancies. We do not believe this is an aberration, but rather a function of a fire exposure unique to the industry. Plastic molding machines combine the extensive use of high-pressure hydraulic oils with ready ignition sources. When high-pressure combustible hydraulic oil sprays from a leak in the system, it frequently finds an ignition source and results in a fireball type of fire that may be one of the most severe exposures encountered by sprinklers in the manufacturing classes — it’s no wonder that large numbers of sprinklers operate almost instantly in these events. Even under the best of circumstances, damage at the ceiling and to adjacent equipment can be severe. Ten to 20 sprinklers can be expected to operate in a typical hydraulic oil fire, whereas fewer than five is typical for industrial fires overall. The average estimated fire damage of a sprinklered hydraulic oil fire in the plastics industry has been about $1.2 million. Exclusive of hydraulic oil fires, the average sprinklered fire damage has been about $500,000.
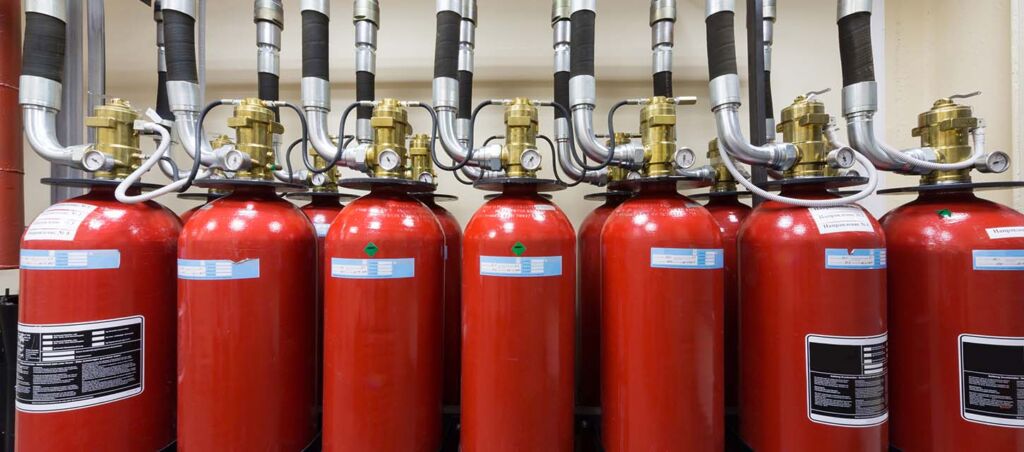
This illustrates a characteristic of industrial fires overall: Whereas damage resulting from non-sprinklered fires tends to be merely a function of the value of the property, as well as the combustibility of the construction and occupancy, the damage from sprinklered fires is driven by the intensity of the hazard in the area of origin. The most damaging sprinklered fire, at slightly greater than $5 million, involved combustible oil where a carbon dioxide extinguishing system operated first but did not fully extinguish the fire.
In fact, it was a single large hydraulic oil fire in a sprinklered facility that skewed the comparison in a relatively small sample in the wood/furniture category. This was the only category where the estimated average damage caused by a sprinklered fire was actually higher than that of a non-sprinklered fire — $582,000 to $438,000, respectively. Without the single large hydraulic oil fire, however, the estimated average damage caused by sprinklered fires would have been $391,000 — a relatively small differential due to the fortunate lack of serious non-sprinklered fires.
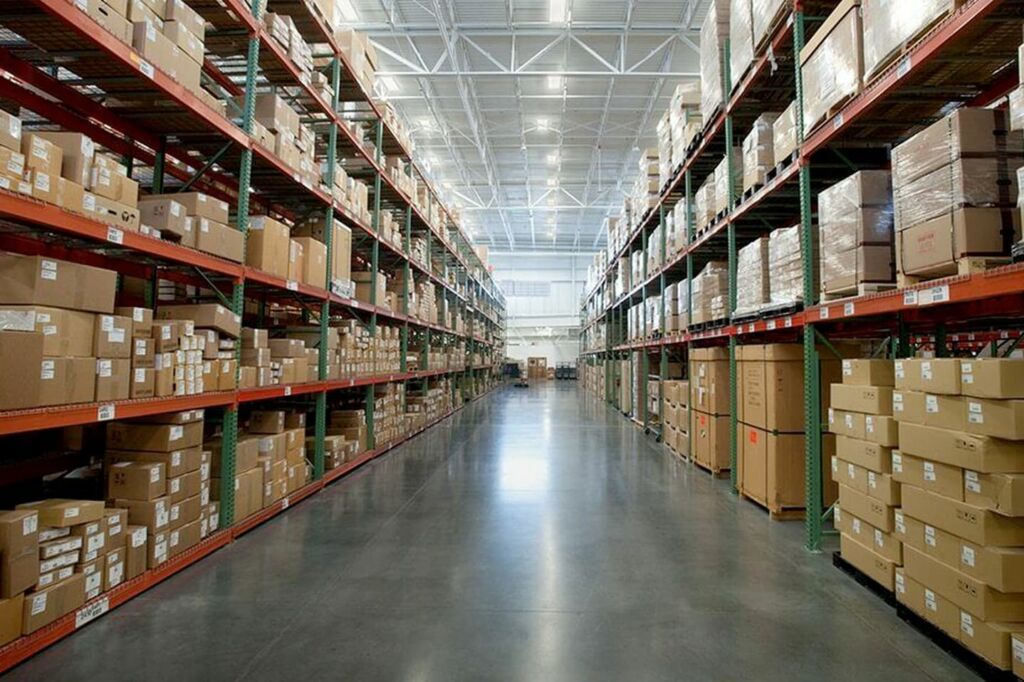
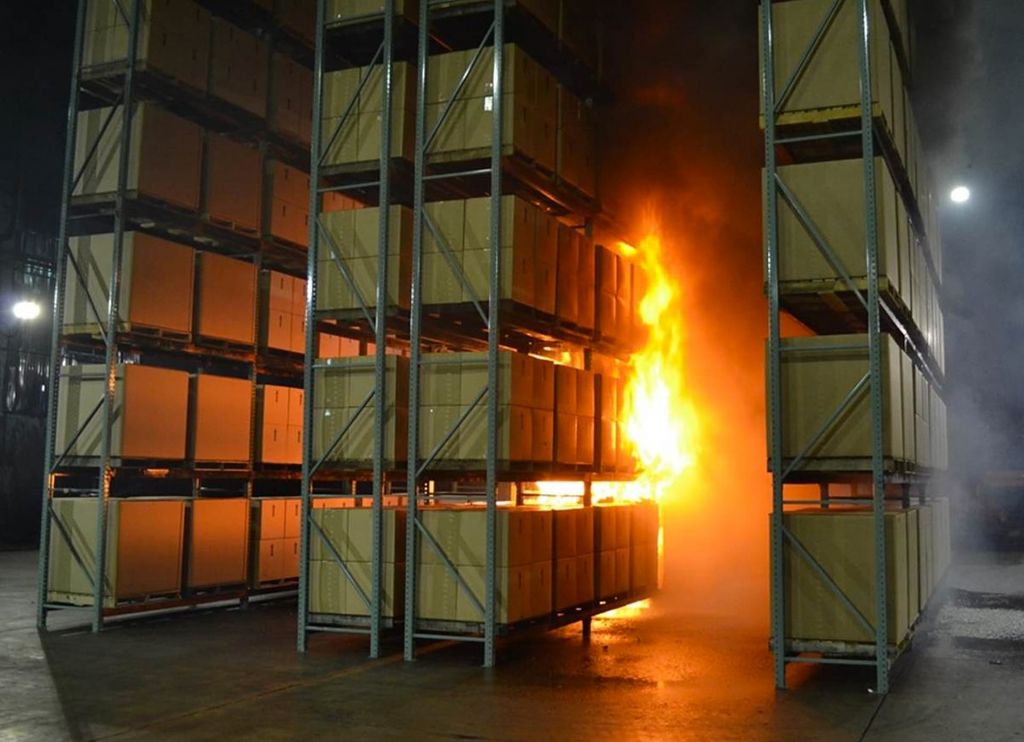
While the study included warehousing as an industrial occupancy, there are so many variables of commodity, storage height, arrangement, sprinkler design, and other factors that an enormous amount of loss data would be needed to drill into it very deeply. From a loss point of view, there was not a large number of fires to generate the data. The study did find that fires in facilities without sprinklers typically did three times more damage than those in sprinklered properties, which was in line with the 3:1 ratio generally found across all occupancies.
The human element
The study also revealed cases where sprinklers were present but were impeded or impaired. Most of these cases — where sprinklers were present but failed to control the fire within expected limits — could be traced to failures in what we termed the “human element,” which are those activities, conducted by people, that either support or defeat the effectiveness of sprinkler protection.
The human element begins with proper design and review of sprinkler system placement and hardware, as well as competent evaluation of the water supply to meet the intensity of the fire anticipated by the occupancy. For best results, system design should anticipate the most challenging conditions, not necessarily the least costly solution. That said, sprinklers are amazingly resilient and often perform with great effectiveness in spite of design deficiencies.
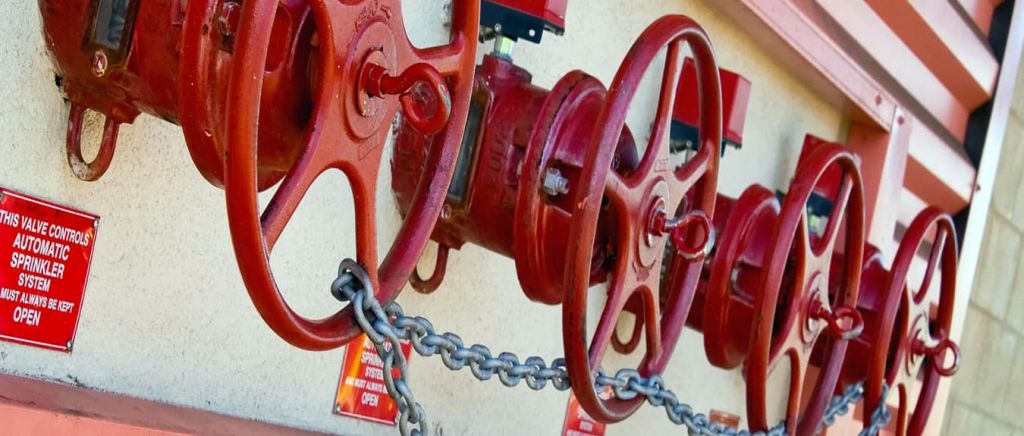
However, they do not compensate well for failures in the post-design human activities intended to keep sprinklers in service. Those activities include regular inspections to make sure valves are open, using an “impairment” system that assures sprinkler systems are restored promptly after repairs, and, perhaps most important, posting a person during emergency situations to make sure sprinkler valves stay open until ordered shut by an authorized person.
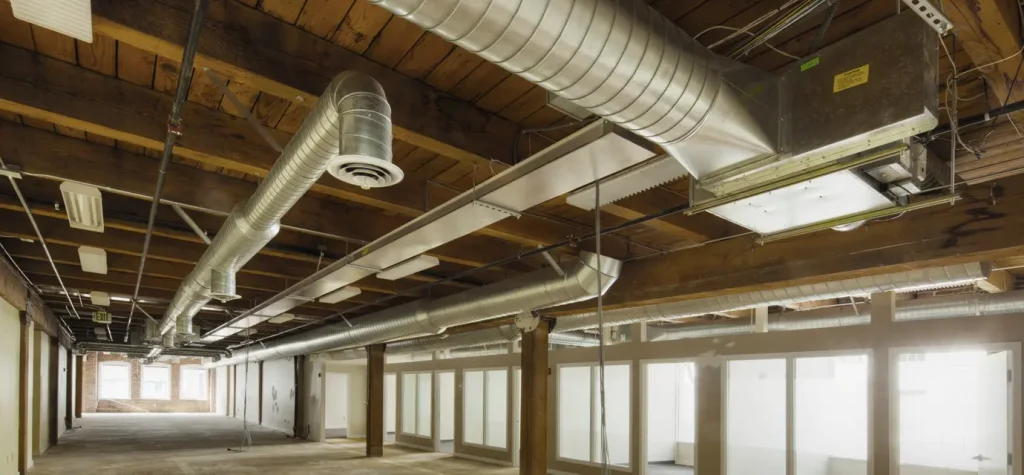
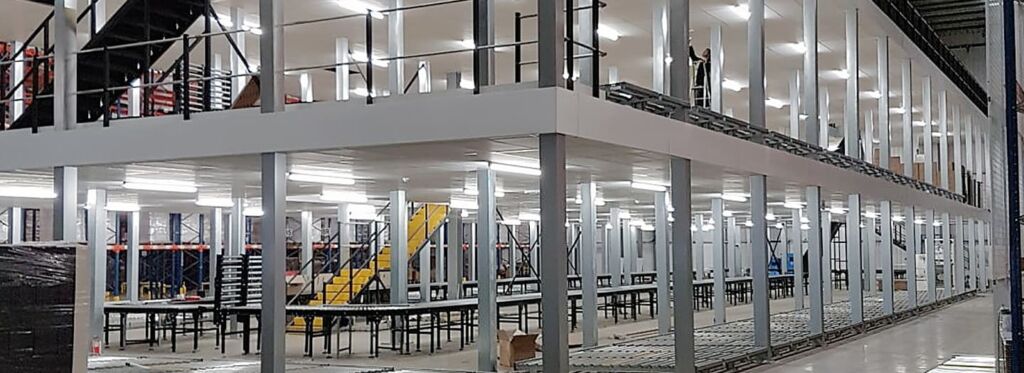
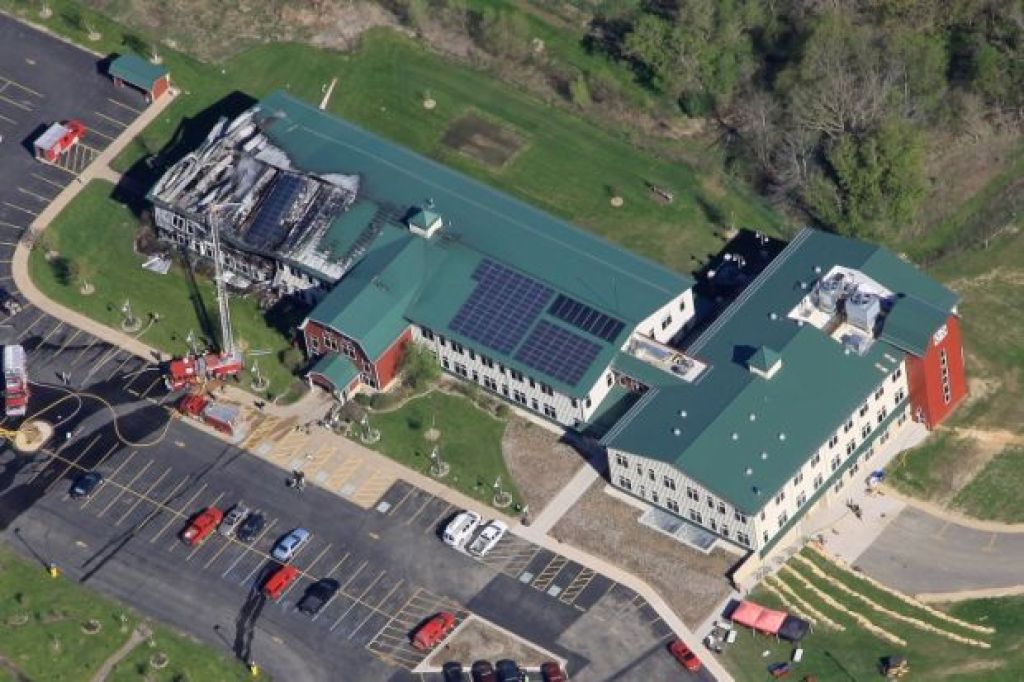
An example of a design/review failure is where sprinklers are omitted in concealed spaces, in enclosed process equipment such as ovens and printers, from beneath mezzanines, or from other enclosures. In these cases, fire is able to gain headway before encountering sprinklers. On average, fires in this category tend to be as damaging as if there were no sprinklers. However, the balance between fire and water damage leans toward less fire and more water damage when sprinklers are delayed.
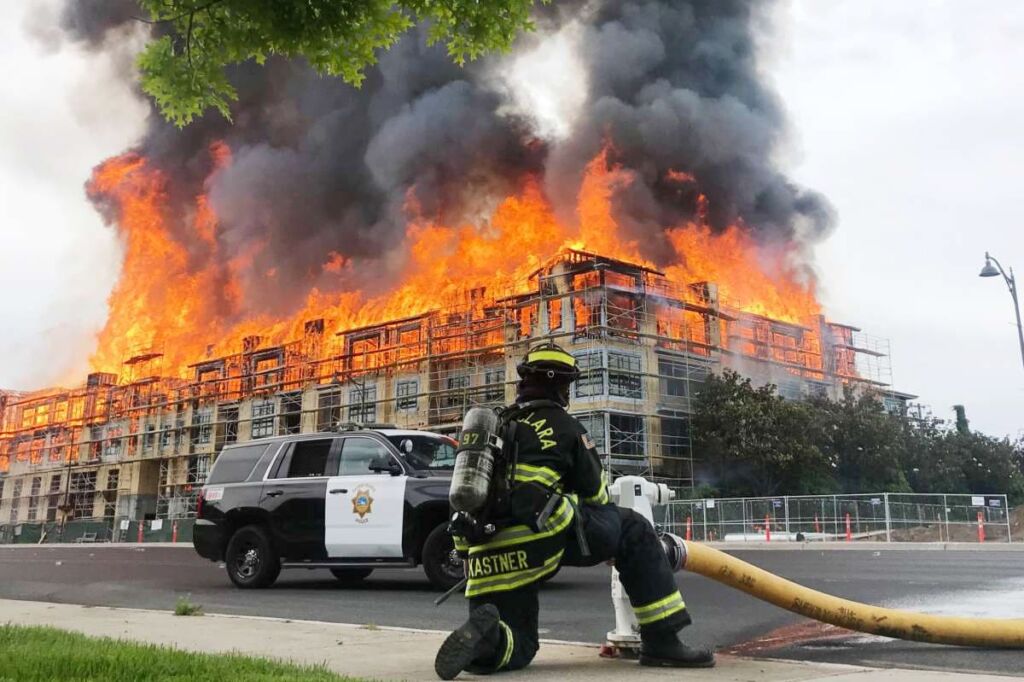
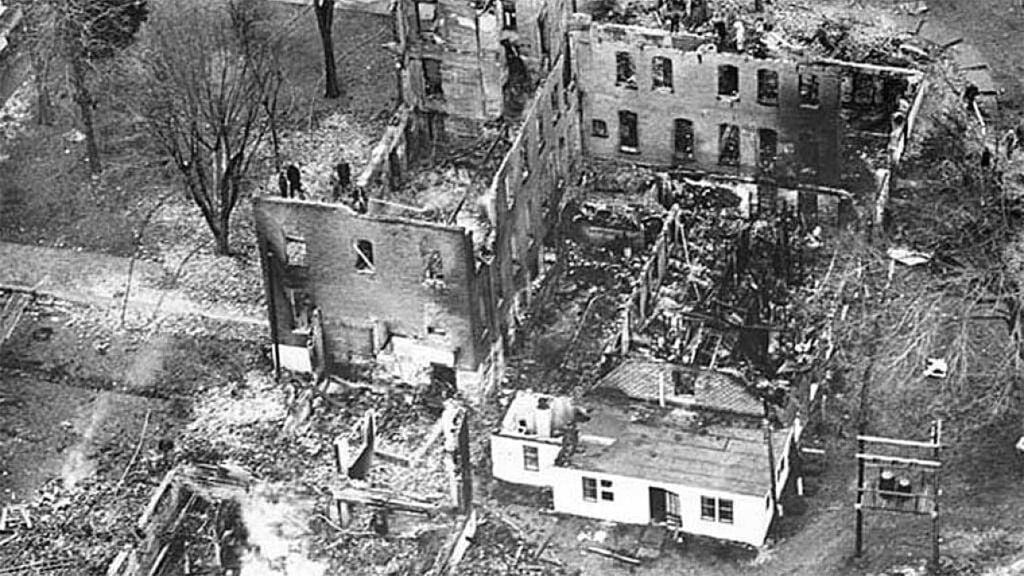
Another example of a design/review failure is a fire in an occupancy that simply overwhelms the ability of sprinklers to control it. Usually these types of fires involve a deficiency in water supplies and are fortunately few and far between. The study includes fires in three warehouses — which stored rubber tires, non-woven textiles, and baled cotton — where deficient water supplies were believed to be the critical factor in the failure to control the fire. All three fires resulted in the total destruction of the buildings and contents.
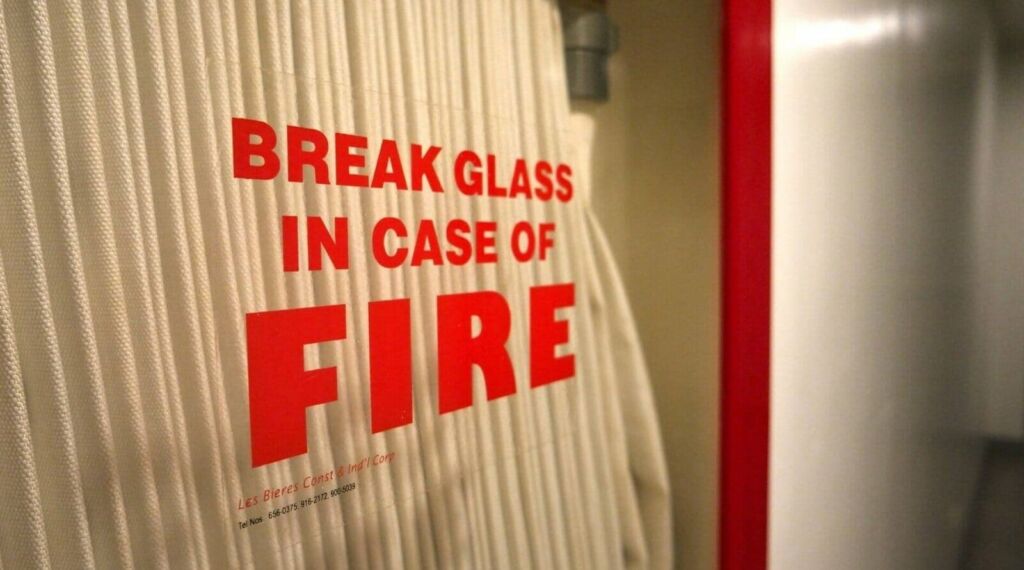
Saddest of all are those post-design/review cases where the capital expense of sprinklers has been incurred but the benefit of sprinkler protection is not realized at the time it is most needed, during the fire. In these situations, known as impairments, sprinklers were present and should have operated, or perhaps even did operate, but were shut off either before the fire event or prematurely during the fire. In almost every instance, the result of shutting off sprinklers before the fire is fully controlled is roughly the same as if sprinklers had not been present. It can also be highly embarrassing for those responsible, which is why it’s often difficult to establish exactly how the impairment occurred. (For examples, see “The Impairment Problem,”)
These are the exceptions, however. The study illustrates clearly that when sprinklers are installed in the area of origin, and when they operate as designed — which occurs in the vast majority of instances — fires almost always remain small, as reflected by the cost of the damage associated with those fires. This is a key reason why the value of automatic sprinklers for all occupancies, from residential to heavy industrial, continues to be more widely recognized, not just in the United States but around the world.
It is our hope that that momentum will continue, aided by the work of NFPA, major insurers, firefighting organizations, and other stakeholders to constantly investigate improvements in hardware and to upgrade sprinkler installation codes and standards. That collective effort will ensure that automatic sprinklers continue to fulfill their promise of reduced loss of life and property damage well into the 21st century and beyond.

Fire Sprinkler Installation & Management
Fire Protection Contractors License #C16-1045293
For more information please visit:


PEOPLE We Protect


Our Distributors and Suppliers


Experience
Our team started in the fire protection industry over 20 years ago. Since then we have grown into a statewide fire protection construction leader. Our team of project managers, engineers, designers, inspectors, installers, and technicians all share a passion for quality work and high standards. Precision Fire Protection understands the need to complete projects with integrity, safety, and precision!
Dedication
Our mission is to provide our customers with timely, high quality, affordable fire protection services that are guaranteed. We strive to achieve our client’s complete satisfaction. We are relentless in applying the highest ethical standards to ourselves and to our services and in communications with our customers. We aim to fulfill that mission in everything we do.
Precision
Precision Fire Protection keeps its team together, even when it's not. Just as vital as field personnel’s tools are, our project managers are equipped with the latest software to manage projects. Our project managers send dailies, RFIs, and plan revisions to the cloud so that everyone has access no matter where they are. Being connected is our way of ensuring every project goes smoothly.
Safety
Our team of multi-certified managers and supervisors are highly experienced in job safety. Our managers are OSHA certified to handle each project with care and sensitivity to every unique job site. By ensuring on-site safety on every project we work on throughout Southern California, Precision Fire Protection has developed positive relationships with our General Contractors.
