Precision Fire Protection News
Firefighter Injuries in the United States
Firefighter Injuries in the United States
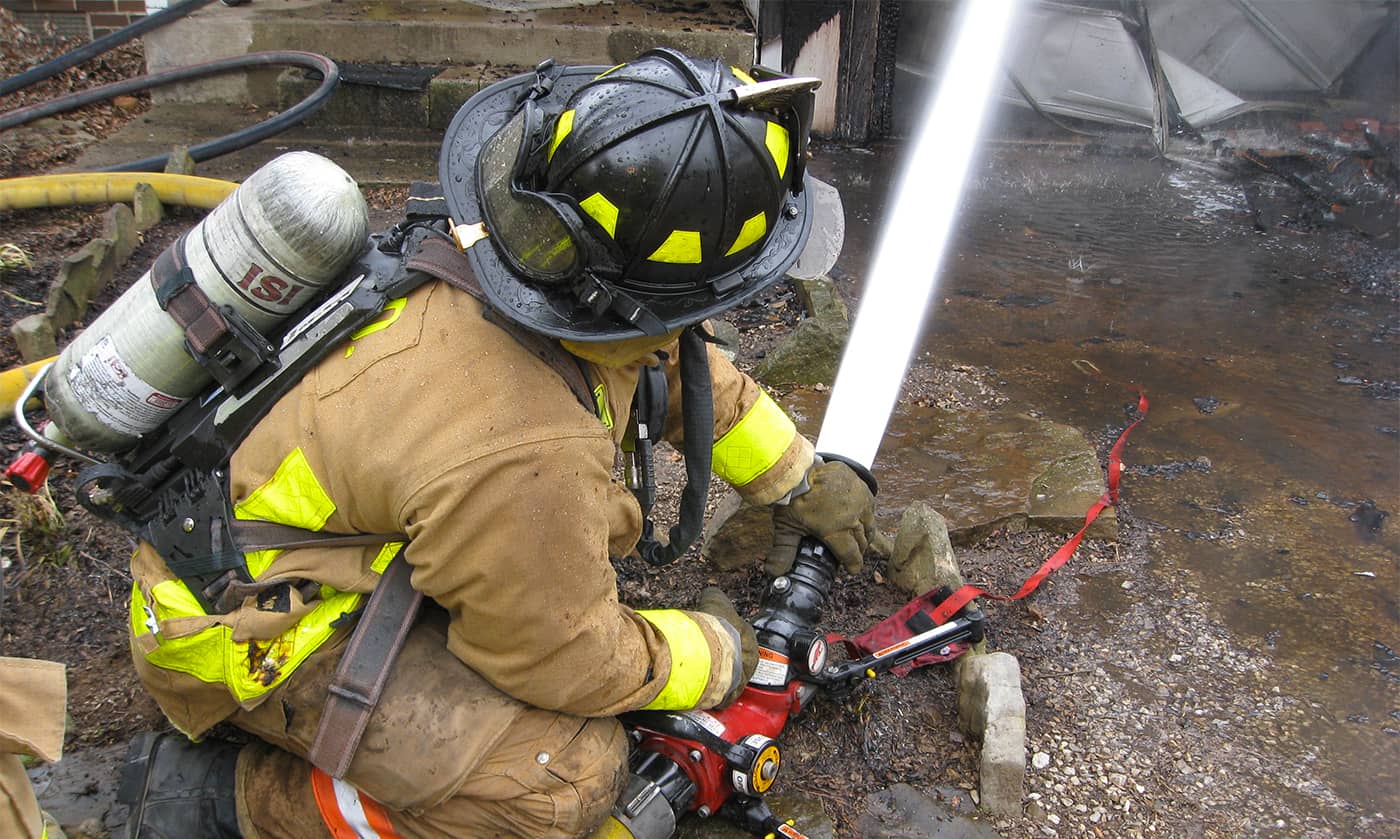
Last year, 60,825 line-of-duty firefighter injuries occurred, a slight uptick over 2018 but one of the lowest totals since this data has been analyzed
BY BEN EVARTS and RICHARD CAMPBELL
Firefighters work in varied and complex environments that increase their risk of on-the-job death and injury. Each year, NFPA studies firefighter deaths and injuries to provide national statistics on their frequency, extent, and characteristics. Earlier this year, NFPA reported that there were 48 on-duty firefighter fatalities in the United States last year (“2019 U.S. Firefighter Fatalities Report,” July/August NFPA Journal). A better understanding of how these fatalities, nonfatal injuries, and illnesses occur can assist in identifying corrective actions that can help minimize the inherent risks of firefighter work.
This article addresses 2019 firefighter injuries in the U.S. The results are based on data collected during the NFPA Survey of Fire Departments for U.S. Fire Experience (2019). An earlier report, “Fire Loss in the United States during 2019,” measured the national fire experience in terms of the number of fires that fire departments responded to and the resulting civilian deaths, civilian injuries, and property losses that occurred.
RELATED: Read the full 2019 Firefighter Injuries report
Based on data reported by fire departments responding to the 2019 National Fire Experience Survey, we estimate that 60,825 firefighter injuries occurred in the line of duty in 2019. This is an increase of four percent over 2018, but nevertheless represents the third-lowest injury total since NFPA began analyzing this data in 1981. Over the past 20 years or so, the number of reported firefighter injuries has been considerably lower than it was in the 1980s and 1990s, due in part to a redefinition of injuries that places exposures to hazardous conditions and infectious diseases in their own categories. Previously, some of these exposures might have been included in total injuries under other categories.
60,825 – Total reported line-of-duty firefighter injuries in 201923,825 – Injuries that occurred at the fireground65% – Percent decline of fireground injuries since 1981, the first year this data was collected 18.4 – Rate of injuries per 1,000 firefighters 3 – Rank of 2019 among years with the lowest per-1,000 injury rates since 1981, behind only 2018 and 2016 14,150 – Injuries that occurred during non-fire emergencies 47% – Percent increase of non-fire emergency injuries since 1981 367% – Percent increase in the number of non-fire emergencies since 1981 8,175 – Injuries that occurred during training activities 10,575 – Injuries that occurred during other on-duty activities 4,100 – Injuries that occurred while responding to or returning from an incident |
INFPA estimates that there were 7,675 exposures to infectious diseases such as hepatitis, meningitis, and HIV in 2019. We also estimate that there were 24,525 exposures to hazardous conditions such as asbestos, radioactive materials, chemicals, and fumes last year.
An estimated 17,575 injuries, or 29 percent of all firefighter injuries, resulted in lost time.
Methods used for this study
NFPA annually surveys a sample of fire departments in the U.S. to make national projections of the fire problem. The sample is stratified by the size of the community protected by the fire department and includes all U.S. fire departments that protect communities with a population larger than 5,000. The 8,672 fire departments in the eight highest strata protect a population of 280 million, or 85 percent of the U.S. population as of July 2019. The rest of the sample includes 15,478 randomly selected departments that protect populations under 5,000, for a total sample size of 24,150, or 83 percent of all fire departments in the U.S. known to NFPA.
The estimation method used for the survey was ratio estimation with stratification by community size. For each firefighter injury statistic, a sample injury rate was computed for each stratum. This rate consisted of the total for that particular statistic from all departments reporting it, divided by the total population protected by the departments reporting the statistic. Note that this means the departments used in calculating each statistic could be different, reflecting differences in unreported statistics. The national projections are made by weighting the sample results according to the proportion of total U.S. population accounted for by communities of each size. Around any estimate based on a sample survey, there is a confidence interval that measures the statistical certainty or uncertainty of the estimate. We are confident that the actual number of total firefighter injuries falls within 5 percent of the estimate.
A total of 2,432 departments responded to the 2019 fire experience survey. The results are based on injuries that occurred during incidents attended by public fire departments. No state or federal firefighting entities were included in this sample, and no adjustments were made for injuries that occurred during fires attended solely by private fire brigades, such as those at industrial or military installations.
Study results
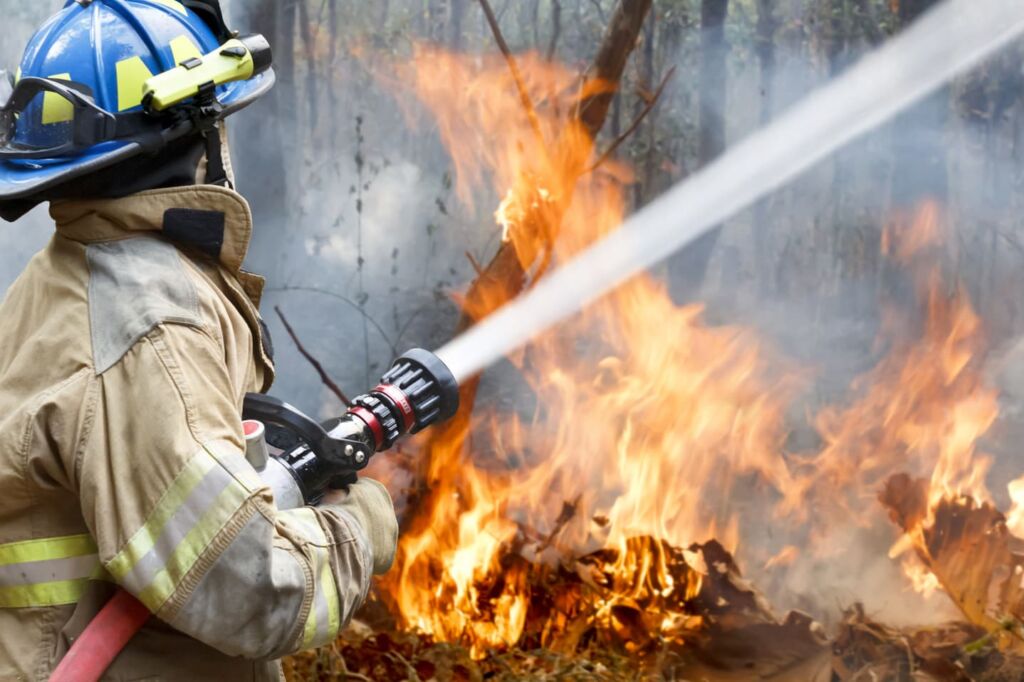
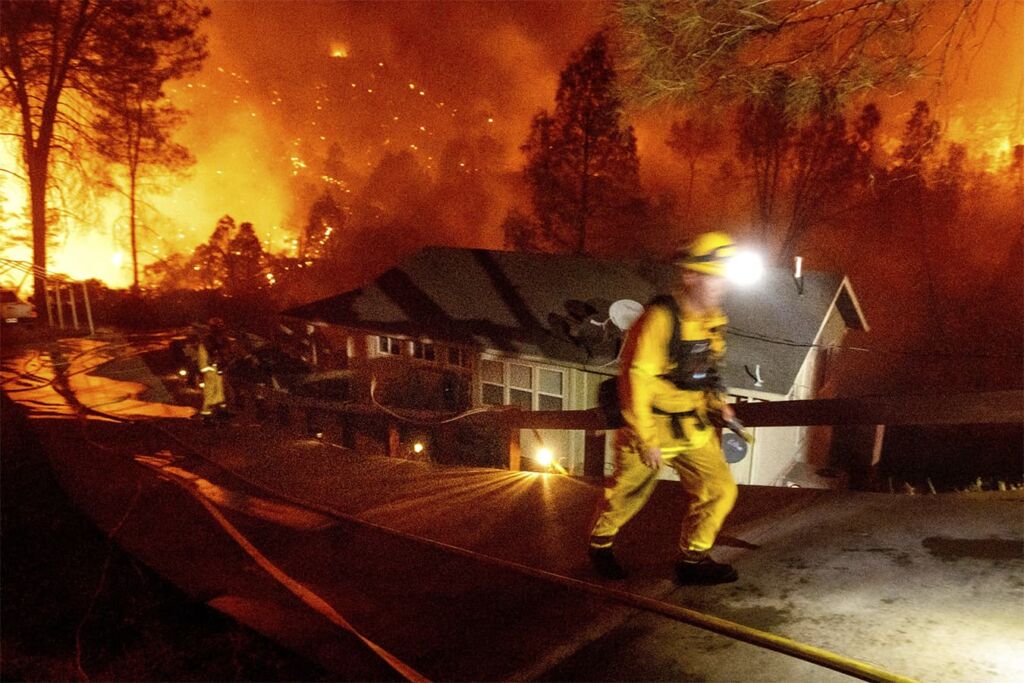
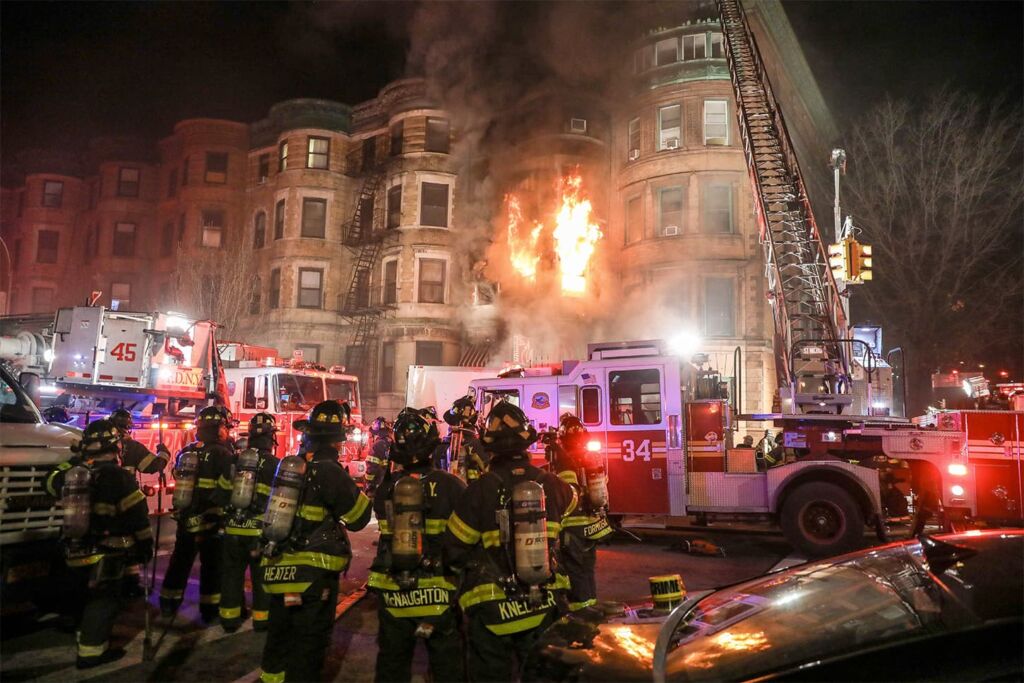
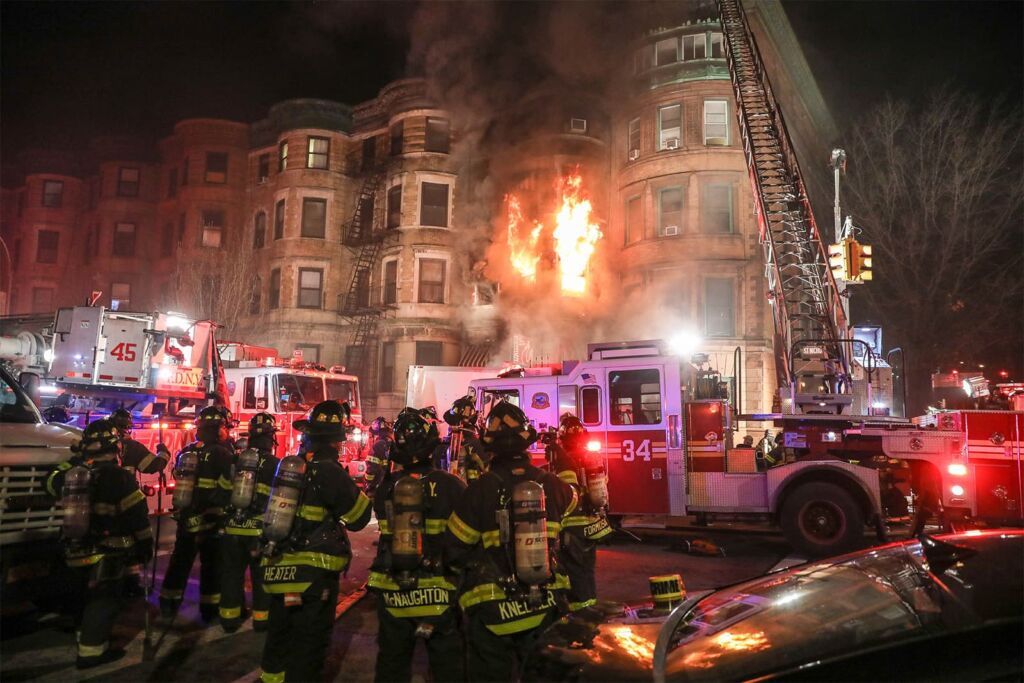
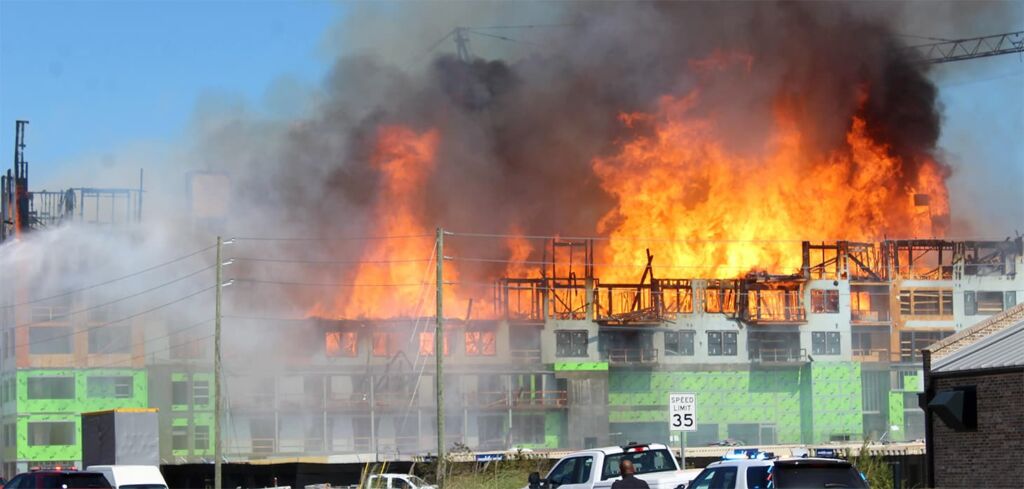
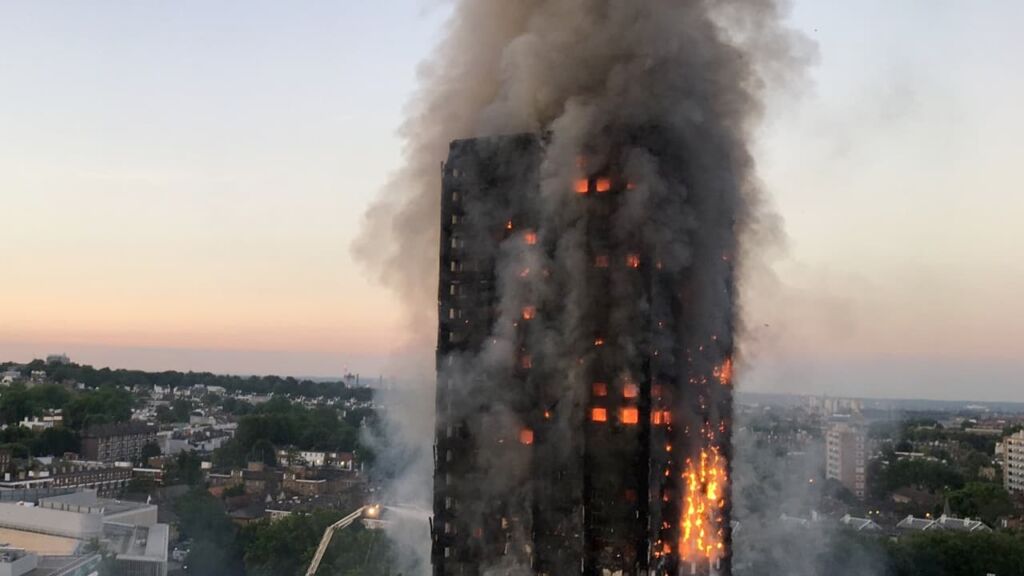
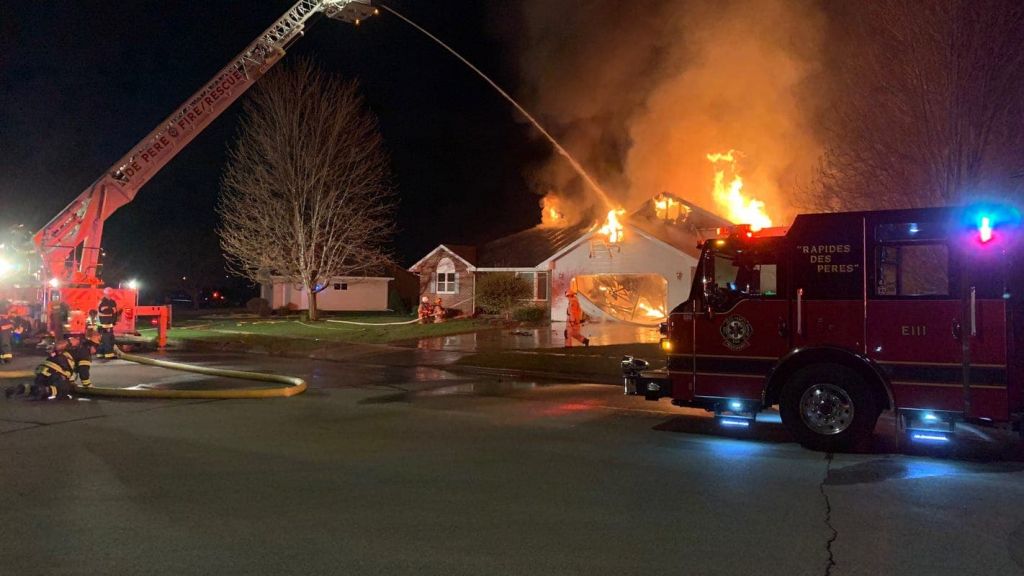
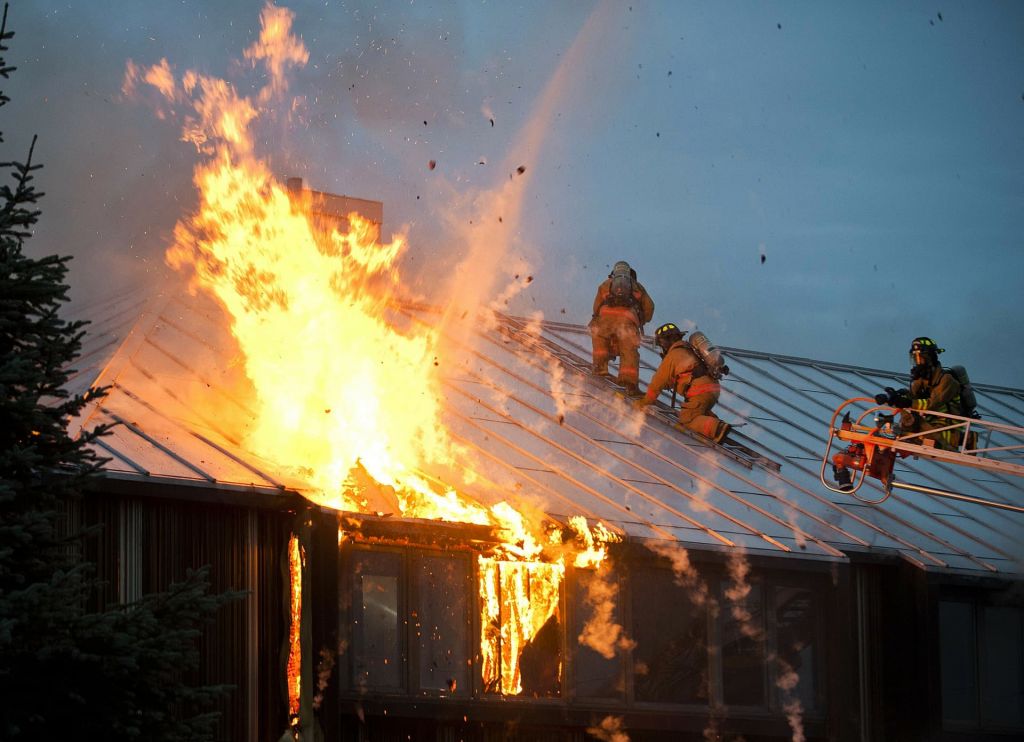
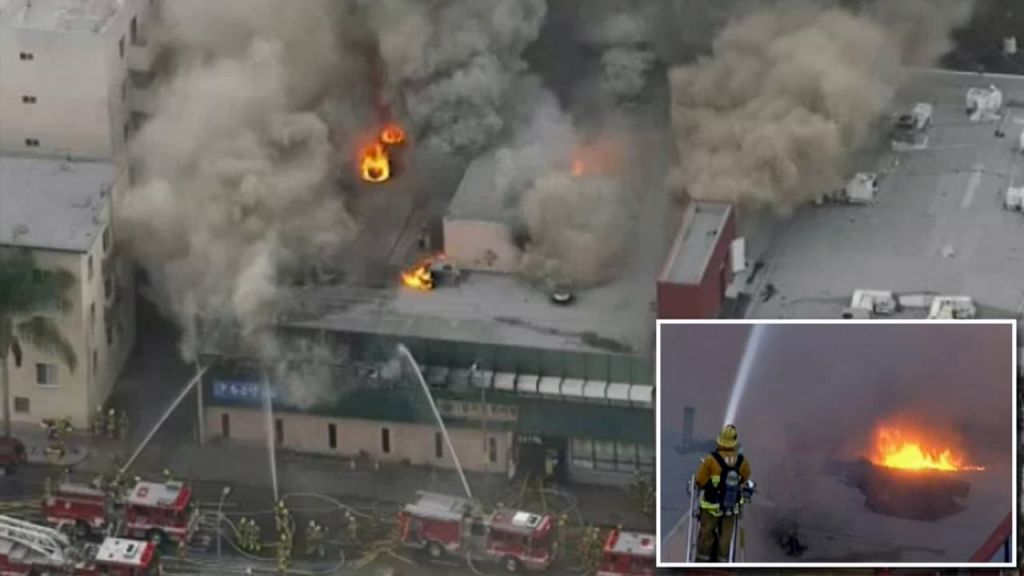
Firefighters were more likely to be injured at fireground operations than at other types of duties. In 2019, 23,825 injuries, or 39 percent of all firefighter injuries, occurred at the fireground. This was a 4 percent increase over 2018. Still, injuries at the fireground in 2019 represented a 65 percent decline from the high of 67,500 injuries in 1981, the first year such data was collected. It should be noted that the annual number of fires has also declined steadily during this period, for an overall decrease of 55 percent. The rate of 18.4 injuries per 1,000 fires in 2019 represented the third-lowest rate over the past 38 years, bettered only by rates of 17.4 injuries per 1,000 fires in 2018 and 18.1 injuries per 1,000 fires in 2016.
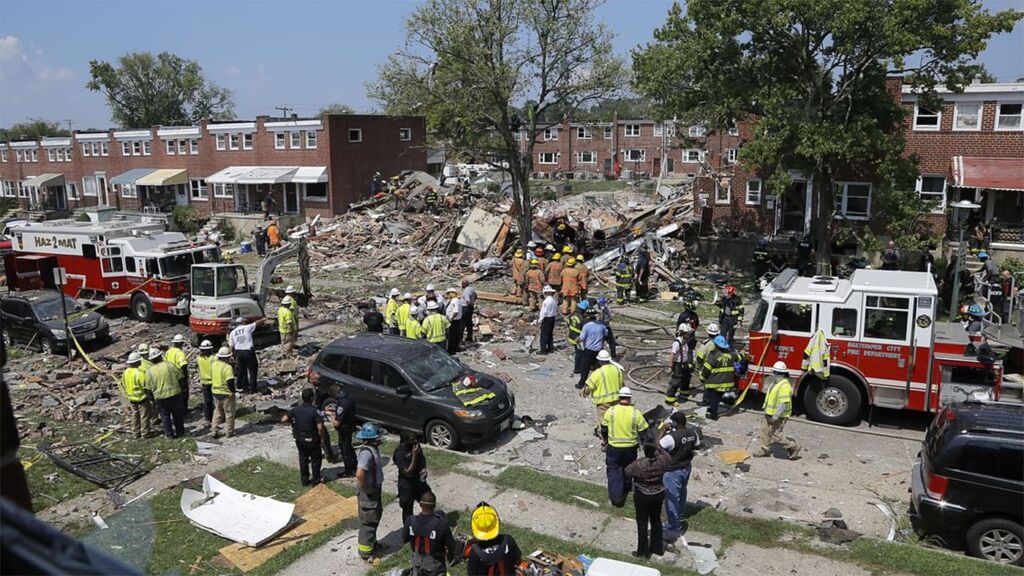
Non-fire emergencies accounted for 14,150 injuries in 2019, a 47 percent higher total than the 9,600 injuries reported for this type of duty in 1981. It is important to note that the number of non-fire emergencies increased by 367 percent over this same period, due in large part to an increase in the number of fire department responses to medical emergencies. The injury rate per 1,000 non-fire emergencies declined between 1981 and 2019, from 1.2 to 0.4, largely because the number of non-fire emergencies increased at a higher rate than the number of injuries at non-fire responses. In general, however, the total number of injuries in non-fire emergencies has shown substantial fluctuation.
Another 8,175 firefighter injuries in 2019 occurred during training activities, and 10,575 injuries occurred during other on-duty activities. In addition, 4,100 firefighter injuries occurred while responding to or returning from an incident.
Nature and cause of fireground injuries
The major types of injuries that occurred during fireground operations were strains and sprains, which accounted for 41 percent of all injuries; wounds, cuts, bleeding, and bruises, which accounted for 13 percent; smoke or gas inhalation, which accounted for 10 percent; and thermal stress, including frostbite or heat exhaustion, with 9 percent. Strains, sprains, and muscular pain were the leading type of injury in all firefighter activities and accounted for 59 percent of all non-fireground injuries, while wounds, cuts, bleeding, and bruises were the second-leading cause of injury in non-fireground activities, accounting for 13 percent of non-fireground injuries.
Because fireground injuries are of particular concern from an occupational hazard perspective, we examined their causes, defined here as the initial circumstance leading to the injury. Overexertion or strain was the leading cause of fireground injuries, with 29 percent of the fireground injury total. Other major causes were falls, jumps, or slips (20 percent) and exposure to fire products (15 percent).
Fire department vehicle collisions
In 2019, an estimated 15,350 collisions involved fire department emergency vehicles responding to or returning from incidents. To put this number in perspective, fire departments responded to more than 37.3 million incidents in 2019, meaning that the number of collisions represents 0.04 percent of total responses. However, these collisions resulted in 575 injuries, or one percent, of all firefighter injuries. Another 800 collisions involved firefighters’ personal vehicles, in which they were responding to or returning from incidents. These collisions resulted in an estimated 10 injuries.
Average fires and fireground injuries per department by population protected
The number of fires a fire department responds to is directly related to the population protected, and the number of fireground injuries incurred by a department is directly related to the number of fires the department attends. The second point is clearly demonstrated when we examine the range of the average number of fireground injuries per year per fire department, which range from a high of 75.3 for departments that protect communities of 500,000 or more, to a low of 0.2 for departments that protect communities with fewer than 2,500 people.
One way to understand the risk that firefighters face is to examine the number of fireground injuries that occur for every 100 fires they attend. This takes into account relative fire experience and allows more direct comparison between departments protecting communities of different sizes. In 2019, the overall range of rates varied from a high of 2.4 injuries per 100 fires for departments that protected communities with populations of 500,000 or more to a low of 1.3 injuries per 100 fires for departments that protected communities with populations between 5,000 and 9,999.
Larger fire departments generally had the highest rates of fireground injuries per firefighter, and departments protecting communities of 500,000 or more experienced 5.5 injuries per 100 firefighters. As the size of the community decreases, the rate of fireground injuries generally declines, to a low of 0.9 per 100 firefighters for departments protecting fewer than 2,500 people. That is a difference in risk of injury per firefighter of more than 6 to 1 between the largest communities protected and the smallest.
Firefighters in larger cities may experience higher injury risks because they make a substantially higher number of calls than those in smaller departments. In addition, the presence of infrastructure and large buildings that involve exposure to more complicated hazards than those in areas with less developed infrastructure and smaller buildings is also an important factor. Fire departments in smaller communities are also more likely to be staffed by volunteer firefighters, who are unlikely to report to every fire and who face lower levels of injury exposure. Different policies for documenting minor injuries and different levels of fire engagement could also explain some of this difference.
Conclusions of the 2019 study
Since 1981 when firefighter injury data was first collected for this report, the overall trend is a decreasing number of firefighter injuries. The most common place for these injuries is at the fireground, but many firefighters are injured elsewhere, including during training exercises and while performing other duties. The risk of injury is common to a full gamut of firefighter job demands.
As the statistics in this report and previous reports attest, firefighting presents risks of personal injury to firefighters. Due to the kind of work performed and the hazards of the incident scene environment, it is unlikely that all firefighter injuries can be eliminated. A risk management system and the application of existing technology, however, can offer options to reduce present injury levels.
PEOPLE We Protect
Our Distributors and Suppliers
Experience
Our team started in the fire protection industry over 20 years ago. Since then we have grown into a statewide fire protection construction leader. Our team of project managers, engineers, designers, inspectors, installers, and technicians all share a passion for quality work and high standards. Precision Fire Protection understands the need to complete projects with integrity, safety, and precision!
Dedication
Our mission is to provide our customers with timely, high quality, affordable fire protection services that are guaranteed. We strive to achieve our client’s complete satisfaction. We are relentless in applying the highest ethical standards to ourselves and to our services and in communications with our customers. We aim to fulfill that mission in everything we do.
Precision
Precision Fire Protection keeps its team together, even when it's not. Just as vital as field personnel’s tools are, our project managers are equipped with the latest software to manage projects. Our project managers send dailies, RFIs, and plan revisions to the cloud so that everyone has access no matter where they are. Being connected is our way of ensuring every project goes smoothly.
Safety
Our team of multi-certified managers and supervisors are highly experienced in job safety. Our managers are OSHA certified to handle each project with care and sensitivity to every unique job site. By ensuring on-site safety on every project we work on throughout Southern California, Precision Fire Protection has developed positive relationships with our General Contractors.


